Data
507,321 items of data are available, covering 487,908 participants.
Defined-instances run from 0 to 1, labelled using Instancing
2.
Units of measurement are mmol/l.
| Maximum | 1.08076 |
| Decile 9 | 0.55281 |
| Decile 8 | 0.51775 |
| Decile 7 | 0.49349 |
| Decile 6 | 0.473281 |
| Median | 0.45493 |
| Decile 4 | 0.43692 |
| Decile 3 | 0.417888 |
| Decile 2 | 0.395949 |
| Decile 1 | 0.366099 |
| Minimum | 0.11524 |
|

|
- Mean = 0.457971
- Std.dev = 0.0741577
- 605 items above graph maximum of 0.739522
|
2 Instances
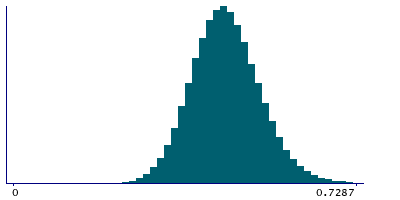
Instance 0 : Initial assessment visit (2006-2010) at which participants were recruited and consent given
487,456 participants, 487,456 items
| Maximum | 1.08076 |
| Decile 9 | 0.552532 |
| Decile 8 | 0.5175 |
| Decile 7 | 0.49327 |
| Decile 6 | 0.4731 |
| Median | 0.45479 |
| Decile 4 | 0.436837 |
| Decile 3 | 0.41787 |
| Decile 2 | 0.395974 |
| Decile 1 | 0.36619 |
| Minimum | 0.11524 |
|
|
- Mean = 0.457841
- Std.dev = 0.0739814
- 569 items above graph maximum of 0.738875
|
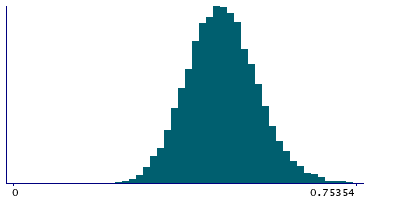
Instance 1 : First repeat assessment visit (2012-13)
19,865 participants, 19,865 items
| Maximum | 0.979255 |
| Decile 9 | 0.559975 |
| Decile 8 | 0.52365 |
| Decile 7 | 0.498752 |
| Decile 6 | 0.47822 |
| Median | 0.45886 |
| Decile 4 | 0.43886 |
| Decile 3 | 0.41842 |
| Decile 2 | 0.39527 |
| Decile 1 | 0.363235 |
| Minimum | 0.19312 |
|
|
- Mean = 0.461158
- Std.dev = 0.0782928
- 33 items above graph maximum of 0.756715
|


