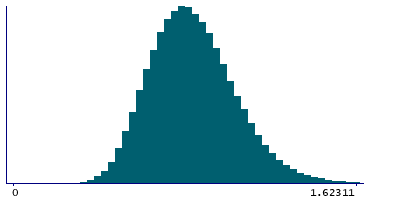
Data
507,961 items of data are available, covering 488,513 participants.
Defined-instances run from 0 to 1, labelled using Instancing
2.
Units of measurement are g/l.
| Maximum | 2.7124 |
| Decile 9 | 1.1262 |
| Decile 8 | 1.02273 |
| Decile 7 | 0.952859 |
| Decile 6 | 0.895408 |
| Median | 0.84298 |
| Decile 4 | 0.7929 |
| Decile 3 | 0.74111 |
| Decile 2 | 0.68412 |
| Decile 1 | 0.60986 |
| Minimum | 0.15432 |
|
|
- Mean = 0.858761
- Std.dev = 0.20401
- 626 items above graph maximum of 1.64254
|
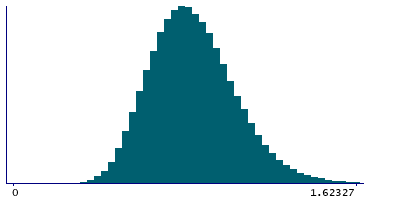
2 Instances
Instance 0 : Initial assessment visit (2006-2010) at which participants were recruited and consent given
488,084 participants, 488,084 items
| Maximum | 2.7124 |
| Decile 9 | 1.12696 |
| Decile 8 | 1.02325 |
| Decile 7 | 0.9534 |
| Decile 6 | 0.895964 |
| Median | 0.84346 |
| Decile 4 | 0.79338 |
| Decile 3 | 0.74169 |
| Decile 2 | 0.684721 |
| Decile 1 | 0.6105 |
| Minimum | 0.15432 |
|
|
- Mean = 0.859342
- Std.dev = 0.204071
- 597 items above graph maximum of 1.64342
|
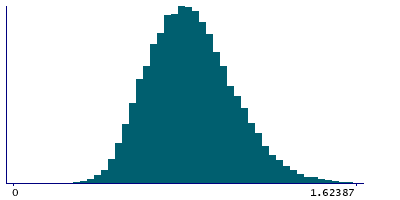
Instance 1 : First repeat assessment visit (2012-13)
19,877 participants, 19,877 items
| Maximum | 1.98553 |
| Decile 9 | 1.1103 |
| Decile 8 | 1.0097 |
| Decile 7 | 0.938845 |
| Decile 6 | 0.881403 |
| Median | 0.83067 |
| Decile 4 | 0.78027 |
| Decile 3 | 0.72842 |
| Decile 2 | 0.66929 |
| Decile 1 | 0.595355 |
| Minimum | 0.29625 |
|
|
- Mean = 0.844488
- Std.dev = 0.201989
- 26 items above graph maximum of 1.62525
|


