Data
507,327 items of data are available, covering 487,913 participants.
Defined-instances run from 0 to 1, labelled using Instancing
2.
Units of measurement are percent.
| Maximum | 84.595 |
| Decile 9 | 41.93 |
| Decile 8 | 40.792 |
| Decile 7 | 39.907 |
| Decile 6 | 39.098 |
| Median | 38.273 |
| Decile 4 | 37.3568 |
| Decile 3 | 36.266 |
| Decile 2 | 34.873 |
| Decile 1 | 32.7584 |
| Minimum | 15.763 |
|

|
- Mean = 37.7523
- Std.dev = 3.65578
- 546 items below graph minimum of 23.5868
- 12 items above graph maximum of 51.1016
|
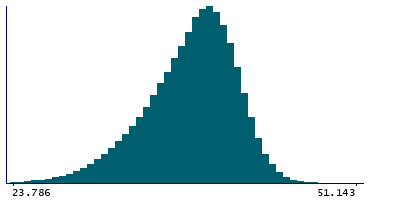
2 Instances
Instance 0 : Initial assessment visit (2006-2010) at which participants were recruited and consent given
487,462 participants, 487,462 items
| Maximum | 84.595 |
| Decile 9 | 41.9466 |
| Decile 8 | 40.8074 |
| Decile 7 | 39.922 |
| Decile 6 | 39.11 |
| Median | 38.2817 |
| Decile 4 | 37.3634 |
| Decile 3 | 36.2673 |
| Decile 2 | 34.869 |
| Decile 1 | 32.7478 |
| Minimum | 15.763 |
|
|
- Mean = 37.7586
- Std.dev = 3.66653
- 517 items below graph minimum of 23.5491
- 12 items above graph maximum of 51.1453
|
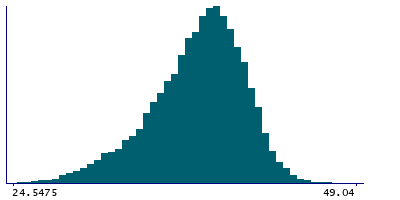
Instance 1 : First repeat assessment visit (2012-13)
19,865 participants, 19,865 items
| Maximum | 49.04 |
| Decile 9 | 41.4845 |
| Decile 8 | 40.399 |
| Decile 7 | 39.557 |
| Decile 6 | 38.813 |
| Median | 38.072 |
| Decile 4 | 37.2102 |
| Decile 3 | 36.241 |
| Decile 2 | 34.9533 |
| Decile 1 | 33.009 |
| Minimum | 19.3128 |
|
|
- Mean = 37.5968
- Std.dev = 3.37743
- 25 items below graph minimum of 24.5335
|


