Data
507,327 items of data are available, covering 487,913 participants.
Defined-instances run from 0 to 1, labelled using Instancing
2.
Units of measurement are percent.
| Maximum | 50.101 |
| Decile 9 | 36.517 |
| Decile 8 | 35.5164 |
| Decile 7 | 34.8733 |
| Decile 6 | 34.363 |
| Median | 33.9082 |
| Decile 4 | 33.467 |
| Decile 3 | 33.0086 |
| Decile 2 | 32.472 |
| Decile 1 | 31.707 |
| Minimum | 9.3278e-05 |
|
|
- Mean = 34.0301
- Std.dev = 1.96721
- 154 items below graph minimum of 26.897
- 976 items above graph maximum of 41.327
|
2 Instances
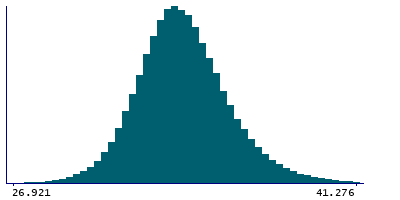
Instance 0 : Initial assessment visit (2006-2010) at which participants were recruited and consent given
487,462 participants, 487,462 items
| Maximum | 50.101 |
| Decile 9 | 36.5207 |
| Decile 8 | 35.518 |
| Decile 7 | 34.871 |
| Decile 6 | 34.359 |
| Median | 33.9043 |
| Decile 4 | 33.4624 |
| Decile 3 | 33.0039 |
| Decile 2 | 32.4686 |
| Decile 1 | 31.7028 |
| Minimum | 9.3278e-05 |
|

|
- Mean = 34.0279
- Std.dev = 1.97017
- 147 items below graph minimum of 26.8849
- 944 items above graph maximum of 41.3386
|
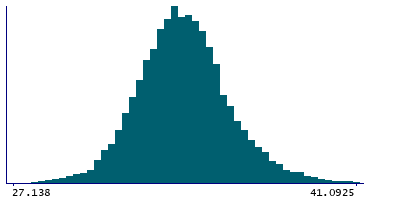
Instance 1 : First repeat assessment visit (2012-13)
19,865 participants, 19,865 items
| Maximum | 46.13 |
| Decile 9 | 36.4535 |
| Decile 8 | 35.493 |
| Decile 7 | 34.9287 |
| Decile 6 | 34.455 |
| Median | 34.0055 |
| Decile 4 | 33.579 |
| Decile 3 | 33.126 |
| Decile 2 | 32.56 |
| Decile 1 | 31.8093 |
| Minimum | 24.89 |
|
|
- Mean = 34.0833
- Std.dev = 1.89225
- 9 items below graph minimum of 27.1652
- 32 items above graph maximum of 41.0977
|


