Data
507,347 items of data are available, covering 487,946 participants.
Defined-instances run from 0 to 1, labelled using Instancing
2.
Units of measurement are mmol/l.
| Maximum | 0.672426 |
| Decile 9 | 0.079241 |
| Decile 8 | 0.074325 |
| Decile 7 | 0.070958 |
| Decile 6 | 0.068187 |
| Median | 0.0656582 |
| Decile 4 | 0.063199 |
| Decile 3 | 0.06063 |
| Decile 2 | 0.0576551 |
| Decile 1 | 0.0535394 |
| Minimum | 0.021156 |
|
|
- Mean = 0.0661761
- Std.dev = 0.0110962
- 17 items below graph minimum of 0.0278377
- 754 items above graph maximum of 0.104943
|
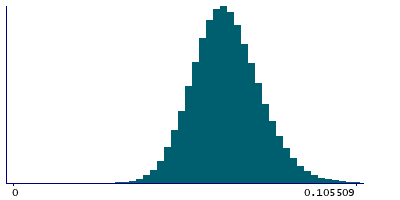
2 Instances
Instance 0 : Initial assessment visit (2006-2010) at which participants were recruited and consent given
487,497 participants, 487,497 items
| Maximum | 0.65739 |
| Decile 9 | 0.079159 |
| Decile 8 | 0.074248 |
| Decile 7 | 0.070892 |
| Decile 6 | 0.068122 |
| Median | 0.0655996 |
| Decile 4 | 0.063144 |
| Decile 3 | 0.0605812 |
| Decile 2 | 0.0576117 |
| Decile 1 | 0.053497 |
| Minimum | 0.021156 |
|

|
- Mean = 0.066114
- Std.dev = 0.0110264
- 17 items below graph minimum of 0.027835
- 717 items above graph maximum of 0.104821
|
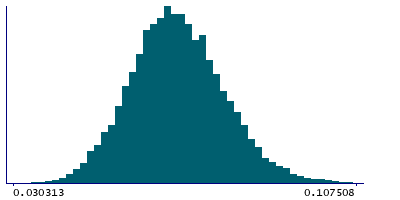
Instance 1 : First repeat assessment visit (2012-13)
19,850 participants, 19,850 items
| Maximum | 0.672426 |
| Decile 9 | 0.081023 |
| Decile 8 | 0.0760681 |
| Decile 7 | 0.072661 |
| Decile 6 | 0.069808 |
| Median | 0.06719 |
| Decile 4 | 0.0646517 |
| Decile 3 | 0.061874 |
| Decile 2 | 0.0589033 |
| Decile 1 | 0.0546 |
| Minimum | 0.030313 |
|
|
- Mean = 0.0677017
- Std.dev = 0.0125949
- 29 items above graph maximum of 0.107446
|


