Data
507,543 items of data are available, covering 488,127 participants.
Defined-instances run from 0 to 1, labelled using Instancing
2.
Units of measurement are mmol/l.
| Maximum | 1.34643 |
| Decile 9 | 0.48432 |
| Decile 8 | 0.43426 |
| Decile 7 | 0.40321 |
| Decile 6 | 0.379563 |
| Median | 0.35916 |
| Decile 4 | 0.340043 |
| Decile 3 | 0.32107 |
| Decile 2 | 0.30037 |
| Decile 1 | 0.2736 |
| Minimum | 0.101 |
|

|
- Mean = 0.371709
- Std.dev = 0.0882835
- 2632 items above graph maximum of 0.695041
|
2 Instances
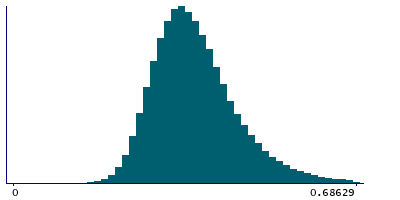
Instance 0 : Initial assessment visit (2006-2010) at which participants were recruited and consent given
487,687 participants, 487,687 items
| Maximum | 1.34643 |
| Decile 9 | 0.484937 |
| Decile 8 | 0.43485 |
| Decile 7 | 0.40376 |
| Decile 6 | 0.38006 |
| Median | 0.359656 |
| Decile 4 | 0.340487 |
| Decile 3 | 0.321452 |
| Decile 2 | 0.30073 |
| Decile 1 | 0.27389 |
| Minimum | 0.101 |
|
|
- Mean = 0.372165
- Std.dev = 0.0883613
- 2507 items above graph maximum of 0.695984
|
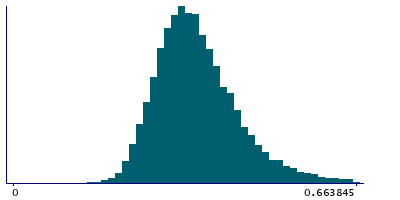
Instance 1 : First repeat assessment visit (2012-13)
19,856 participants, 19,856 items
| Maximum | 1.1106 |
| Decile 9 | 0.466545 |
| Decile 8 | 0.419275 |
| Decile 7 | 0.389369 |
| Decile 6 | 0.366586 |
| Median | 0.34804 |
| Decile 4 | 0.329805 |
| Decile 3 | 0.312125 |
| Decile 2 | 0.292335 |
| Decile 1 | 0.266858 |
| Minimum | 0.13015 |
|
|
- Mean = 0.360518
- Std.dev = 0.0855933
- 149 items above graph maximum of 0.666232
|


