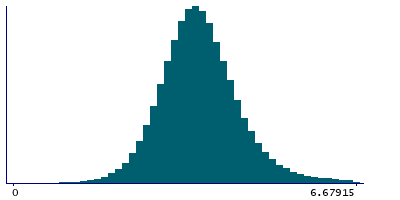
Data
506,989 items of data are available, covering 487,597 participants.
Defined-instances run from 0 to 1, labelled using Instancing
2.
Units of measurement are mmol/l.
| Maximum | 41.833 |
| Decile 9 | 4.7063 |
| Decile 8 | 4.2604 |
| Decile 7 | 3.9997 |
| Decile 6 | 3.7964 |
| Median | 3.61757 |
| Decile 4 | 3.44379 |
| Decile 3 | 3.2604 |
| Decile 2 | 3.0451 |
| Decile 1 | 2.7377 |
| Minimum | 0.272322 |
|
|
- Mean = 3.75922
- Std.dev = 1.19858
- 10049 items above graph maximum of 6.6749
|
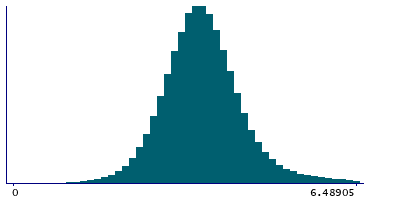
2 Instances
Instance 0 : Initial assessment visit (2006-2010) at which participants were recruited and consent given
487,140 participants, 487,140 items
| Maximum | 41.833 |
| Decile 9 | 4.6358 |
| Decile 8 | 4.20278 |
| Decile 7 | 3.95387 |
| Decile 6 | 3.7594 |
| Median | 3.58692 |
| Decile 4 | 3.4174 |
| Decile 3 | 3.2386 |
| Decile 2 | 3.0266 |
| Decile 1 | 2.7213 |
| Minimum | 0.272322 |
|
|
- Mean = 3.72549
- Std.dev = 1.19425
- 10167 items above graph maximum of 6.5503
|
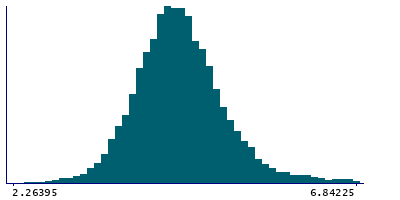
Instance 1 : First repeat assessment visit (2012-13)
19,849 participants, 19,849 items
| Maximum | 29.019 |
| Decile 9 | 5.3233 |
| Decile 8 | 4.9601 |
| Decile 7 | 4.76445 |
| Decile 6 | 4.60375 |
| Median | 4.4655 |
| Decile 4 | 4.32825 |
| Decile 3 | 4.1931 |
| Decile 2 | 4.0244 |
| Decile 1 | 3.79515 |
| Minimum | 1.3647 |
|
|
- Mean = 4.58684
- Std.dev = 0.989059
- 13 items below graph minimum of 2.267
- 411 items above graph maximum of 6.85145
|


