Data
507,069 items of data are available, covering 487,691 participants.
Defined-instances run from 0 to 1, labelled using Instancing
2.
Units of measurement are mmol/l.
| Maximum | 22.959 |
| Decile 9 | 5.48817 |
| Decile 8 | 4.86817 |
| Decile 7 | 4.4695 |
| Decile 6 | 4.1507 |
| Median | 3.8673 |
| Decile 4 | 3.5952 |
| Decile 3 | 3.3185 |
| Decile 2 | 3.011 |
| Decile 1 | 2.61524 |
| Minimum | 0.72216 |
|
|
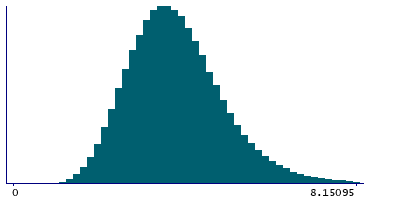
- Mean = 3.98782
- Std.dev = 1.17004
- 1672 items above graph maximum of 8.3611
|
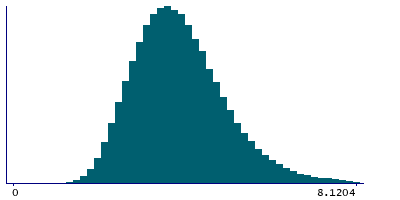
2 Instances
Instance 0 : Initial assessment visit (2006-2010) at which participants were recruited and consent given
487,235 participants, 487,235 items
| Maximum | 22.959 |
| Decile 9 | 5.5183 |
| Decile 8 | 4.90219 |
| Decile 7 | 4.50459 |
| Decile 6 | 4.1904 |
| Median | 3.9113 |
| Decile 4 | 3.64468 |
| Decile 3 | 3.3745 |
| Decile 2 | 3.07854 |
| Decile 1 | 2.6993 |
| Minimum | 0.72216 |
|
|
- Mean = 4.04029
- Std.dev = 1.1504
- 1725 items above graph maximum of 8.3373
|
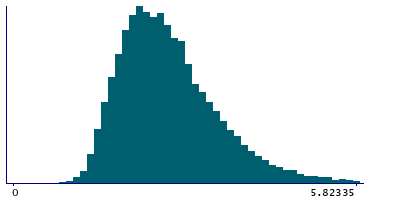
Instance 1 : First repeat assessment visit (2012-13)
19,834 participants, 19,834 items
| Maximum | 12.2269 |
| Decile 9 | 3.8465 |
| Decile 8 | 3.34435 |
| Decile 7 | 3.01397 |
| Decile 6 | 2.76971 |
| Median | 2.5554 |
| Decile 4 | 2.36227 |
| Decile 3 | 2.1671 |
| Decile 2 | 1.972 |
| Decile 1 | 1.73265 |
| Minimum | 0.78073 |
|
|
- Mean = 2.69894
- Std.dev = 0.871429
- 72 items above graph maximum of 5.96035
|


