Data
497,829 items of data are available, covering 479,096 participants.
Defined-instances run from 0 to 1, labelled using Instancing
2.
Units of measurement are mmol/l.
| Maximum | 3.8434 |
| Decile 9 | 0.12185 |
| Decile 8 | 0.080592 |
| Decile 7 | 0.0621975 |
| Decile 6 | 0.0518139 |
| Median | 0.044572 |
| Decile 4 | 0.03875 |
| Decile 3 | 0.0334343 |
| Decile 2 | 0.027971 |
| Decile 1 | 0.021159 |
| Minimum | 0 |
|
|
- Mean = 0.0621491
- Std.dev = 0.0617607
- 12399 items above graph maximum of 0.222541
|
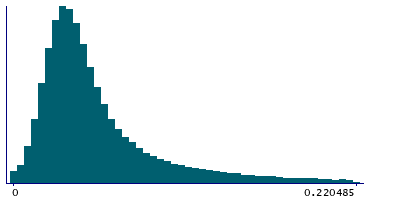
2 Instances
Instance 0 : Initial assessment visit (2006-2010) at which participants were recruited and consent given
478,375 participants, 478,375 items
| Maximum | 3.8434 |
| Decile 9 | 0.12217 |
| Decile 8 | 0.0808436 |
| Decile 7 | 0.0623989 |
| Decile 6 | 0.0519833 |
| Median | 0.044732 |
| Decile 4 | 0.038913 |
| Decile 3 | 0.033596 |
| Decile 2 | 0.0281242 |
| Decile 1 | 0.0213309 |
| Minimum | 0 |
|
|
- Mean = 0.0623588
- Std.dev = 0.0618977
- 11915 items above graph maximum of 0.223009
|
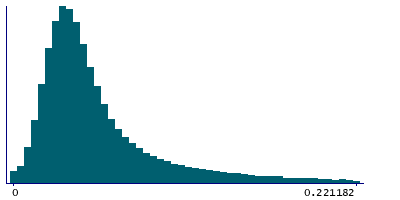
Instance 1 : First repeat assessment visit (2012-13)
19,454 participants, 19,454 items
| Maximum | 1.12 |
| Decile 9 | 0.11277 |
| Decile 8 | 0.074412 |
| Decile 7 | 0.057448 |
| Decile 6 | 0.047402 |
| Median | 0.0404396 |
| Decile 4 | 0.034841 |
| Decile 3 | 0.029678 |
| Decile 2 | 0.024376 |
| Decile 1 | 0.0175582 |
| Minimum | 0 |
|

|
- Mean = 0.0569916
- Std.dev = 0.0580532
- 509 items above graph maximum of 0.207982
|


