Data
507,731 items of data are available, covering 488,311 participants.
Defined-instances run from 0 to 1, labelled using Instancing
2.
Units of measurement are mmol/l.
| Maximum | 1.96588 |
| Decile 9 | 0.0259947 |
| Decile 8 | 0.021383 |
| Decile 7 | 0.018777 |
| Decile 6 | 0.016858 |
| Median | 0.015238 |
| Decile 4 | 0.0137299 |
| Decile 3 | 0.012209 |
| Decile 2 | 0.010497 |
| Decile 1 | 0.0081245 |
| Minimum | 0 |
|
|
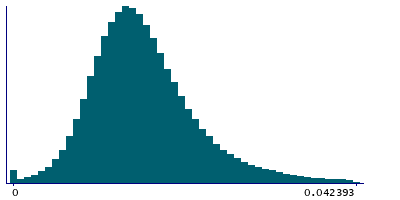
- Mean = 0.0186554
- Std.dev = 0.035564
- 8583 items above graph maximum of 0.0438649
|
2 Instances
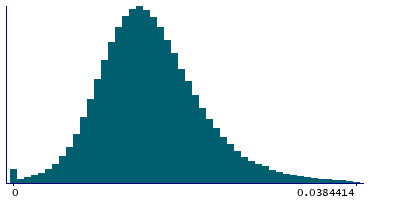
Instance 0 : Initial assessment visit (2006-2010) at which participants were recruited and consent given
487,865 participants, 487,865 items
| Maximum | 1.96588 |
| Decile 9 | 0.02457 |
| Decile 8 | 0.0206152 |
| Decile 7 | 0.0182669 |
| Decile 6 | 0.0164835 |
| Median | 0.014955 |
| Decile 4 | 0.0135041 |
| Decile 3 | 0.012029 |
| Decile 2 | 0.0103535 |
| Decile 1 | 0.008004 |
| Minimum | 0 |
|
|
- Mean = 0.0181293
- Std.dev = 0.0357122
- 7507 items above graph maximum of 0.0411361
|
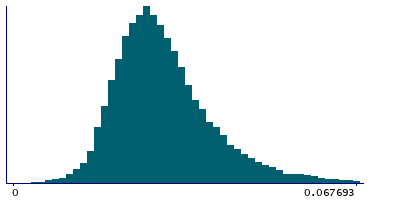
Instance 1 : First repeat assessment visit (2012-13)
19,866 participants, 19,866 items
| Maximum | 1.4003 |
| Decile 9 | 0.043946 |
| Decile 8 | 0.0372506 |
| Decile 7 | 0.033388 |
| Decile 6 | 0.0306455 |
| Median | 0.0283631 |
| Decile 4 | 0.0263055 |
| Decile 3 | 0.02424 |
| Decile 2 | 0.0219745 |
| Decile 1 | 0.0190715 |
| Minimum | 0 |
|
|
- Mean = 0.0315742
- Std.dev = 0.0288396
- 267 items above graph maximum of 0.0688205
|


