Data
507,947 items of data are available, covering 488,499 participants.
Defined-instances run from 0 to 1, labelled using Instancing
2.
Units of measurement are mmol/l.
| Maximum | 0.83821 |
| Decile 9 | 0.026148 |
| Decile 8 | 0.018379 |
| Decile 7 | 0.0145144 |
| Decile 6 | 0.01202 |
| Median | 0.010136 |
| Decile 4 | 0.00857602 |
| Decile 3 | 0.0071293 |
| Decile 2 | 0.00564718 |
| Decile 1 | 0.00385541 |
| Minimum | 0 |
|

|
- Mean = 0.0134124
- Std.dev = 0.0126303
- 10579 items above graph maximum of 0.0484406
|
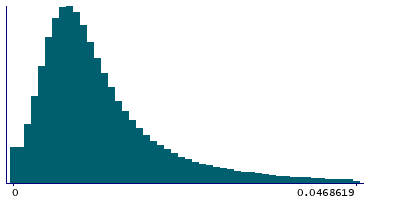
2 Instances
Instance 0 : Initial assessment visit (2006-2010) at which participants were recruited and consent given
488,070 participants, 488,070 items
| Maximum | 0.83821 |
| Decile 9 | 0.025841 |
| Decile 8 | 0.01814 |
| Decile 7 | 0.014332 |
| Decile 6 | 0.0118834 |
| Median | 0.010033 |
| Decile 4 | 0.00849616 |
| Decile 3 | 0.00707129 |
| Decile 2 | 0.0056057 |
| Decile 1 | 0.003824 |
| Minimum | 0 |
|
|
- Mean = 0.0132651
- Std.dev = 0.0125026
- 10185 items above graph maximum of 0.047858
|
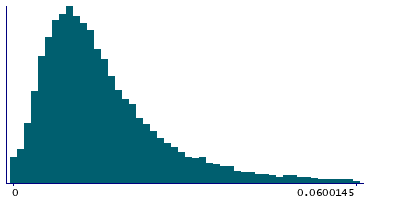
Instance 1 : First repeat assessment visit (2012-13)
19,877 participants, 19,877 items
| Maximum | 0.24993 |
| Decile 9 | 0.032416 |
| Decile 8 | 0.0235145 |
| Decile 7 | 0.0189005 |
| Decile 6 | 0.015712 |
| Median | 0.013288 |
| Decile 4 | 0.0111778 |
| Decile 3 | 0.0092401 |
| Decile 2 | 0.00719235 |
| Decile 1 | 0.0049352 |
| Minimum | 0 |
|
|
- Mean = 0.0170277
- Std.dev = 0.0149928
- 416 items above graph maximum of 0.0598968
|


