Data
507,960 items of data are available, covering 488,512 participants.
Defined-instances run from 0 to 1, labelled using Instancing
2.
Units of measurement are mmol/l.
| Maximum | 3.6941 |
| Decile 9 | 0.50514 |
| Decile 8 | 0.371539 |
| Decile 7 | 0.28446 |
| Decile 6 | 0.21776 |
| Median | 0.164281 |
| Decile 4 | 0.12032 |
| Decile 3 | 0.0831155 |
| Decile 2 | 0.049361 |
| Decile 1 | 0.020051 |
| Minimum | 0.00011082 |
|
|
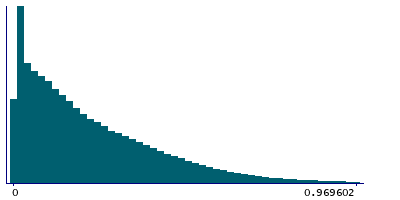
- Mean = 0.224148
- Std.dev = 0.210676
- 3705 items above graph maximum of 0.990229
|
2 Instances
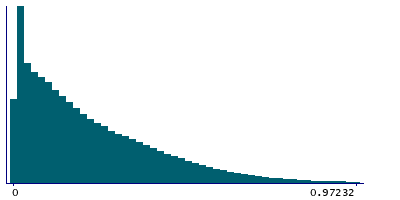
Instance 0 : Initial assessment visit (2006-2010) at which participants were recruited and consent given
488,083 participants, 488,083 items
| Maximum | 3.6941 |
| Decile 9 | 0.50646 |
| Decile 8 | 0.37254 |
| Decile 7 | 0.28514 |
| Decile 6 | 0.218135 |
| Median | 0.16444 |
| Decile 4 | 0.12033 |
| Decile 3 | 0.083033 |
| Decile 2 | 0.0491869 |
| Decile 1 | 0.0199524 |
| Minimum | 0.00011082 |
|
|
- Mean = 0.224583
- Std.dev = 0.211346
- 3567 items above graph maximum of 0.992968
|
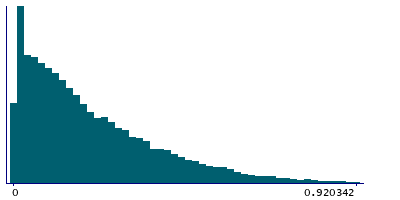
Instance 1 : First repeat assessment visit (2012-13)
19,877 participants, 19,877 items
| Maximum | 2.35188 |
| Decile 9 | 0.471865 |
| Decile 8 | 0.348429 |
| Decile 7 | 0.26937 |
| Decile 6 | 0.208415 |
| Median | 0.16104 |
| Decile 4 | 0.120095 |
| Decile 3 | 0.0854019 |
| Decile 2 | 0.0534515 |
| Decile 1 | 0.0231529 |
| Minimum | 0.00069564 |
|
|
- Mean = 0.213459
- Std.dev = 0.193192
- 147 items above graph maximum of 0.920577
|


