Data
507,960 items of data are available, covering 488,512 participants.
Defined-instances run from 0 to 1, labelled using Instancing
2.
Units of measurement are mmol/l.
| Maximum | 2.6617 |
| Decile 9 | 0.31241 |
| Decile 8 | 0.22494 |
| Decile 7 | 0.16901 |
| Decile 6 | 0.126163 |
| Median | 0.092467 |
| Decile 4 | 0.0651873 |
| Decile 3 | 0.0428076 |
| Decile 2 | 0.023296 |
| Decile 1 | 0.00754708 |
| Minimum | 2.7156e-09 |
|
|
- Mean = 0.133563
- Std.dev = 0.136272
- 4494 items above graph maximum of 0.617273
|
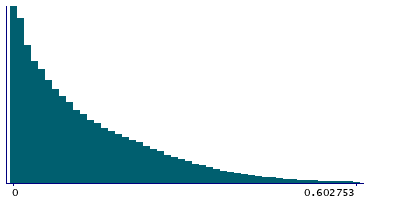
2 Instances
Instance 0 : Initial assessment visit (2006-2010) at which participants were recruited and consent given
488,083 participants, 488,083 items
| Maximum | 2.6617 |
| Decile 9 | 0.313232 |
| Decile 8 | 0.22547 |
| Decile 7 | 0.16935 |
| Decile 6 | 0.126369 |
| Median | 0.0924992 |
| Decile 4 | 0.0651465 |
| Decile 3 | 0.0427015 |
| Decile 2 | 0.023155 |
| Decile 1 | 0.00747267 |
| Minimum | 2.7156e-09 |
|

|
- Mean = 0.133787
- Std.dev = 0.136676
- 4306 items above graph maximum of 0.61899
|
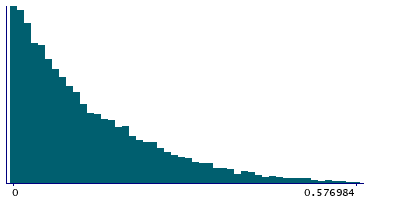
Instance 1 : First repeat assessment visit (2012-13)
19,877 participants, 19,877 items
| Maximum | 1.60692 |
| Decile 9 | 0.29367 |
| Decile 8 | 0.212596 |
| Decile 7 | 0.161065 |
| Decile 6 | 0.12154 |
| Median | 0.0916225 |
| Decile 4 | 0.066092 |
| Decile 3 | 0.0452142 |
| Decile 2 | 0.026172 |
| Decile 1 | 0.00950474 |
| Minimum | 9.584e-09 |
|
|
- Mean = 0.12806
- Std.dev = 0.125819
- 175 items above graph maximum of 0.577835
|


