Data
507,960 items of data are available, covering 488,512 participants.
Defined-instances run from 0 to 1, labelled using Instancing
2.
Units of measurement are mmol/l.
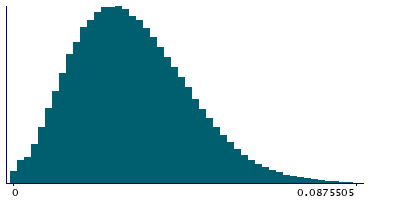
| Maximum | 0.165094 |
| Decile 9 | 0.051002 |
| Decile 8 | 0.043164 |
| Decile 7 | 0.03774 |
| Decile 6 | 0.0332488 |
| Median | 0.029213 |
| Decile 4 | 0.025402 |
| Decile 3 | 0.021577 |
| Decile 2 | 0.0174622 |
| Decile 1 | 0.012401 |
| Minimum | 1.52795e-06 |
|
|
- Mean = 0.0307566
- Std.dev = 0.0151975
- 638 items above graph maximum of 0.089603
|
2 Instances
Instance 0 : Initial assessment visit (2006-2010) at which participants were recruited and consent given
488,083 participants, 488,083 items
| Maximum | 0.165094 |
| Decile 9 | 0.0510881 |
| Decile 8 | 0.0432492 |
| Decile 7 | 0.0378191 |
| Decile 6 | 0.0333179 |
| Median | 0.029266 |
| Decile 4 | 0.025443 |
| Decile 3 | 0.0216035 |
| Decile 2 | 0.0174863 |
| Decile 1 | 0.0124089 |
| Minimum | 1.52795e-06 |
|

|
- Mean = 0.0308109
- Std.dev = 0.015231
- 612 items above graph maximum of 0.0897672
|
Instance 1 : First repeat assessment visit (2012-13)
19,877 participants, 19,877 items
| Maximum | 0.11781 |
| Decile 9 | 0.048628 |
| Decile 8 | 0.0410495 |
| Decile 7 | 0.0358286 |
| Decile 6 | 0.031651 |
| Median | 0.0279775 |
| Decile 4 | 0.024468 |
| Decile 3 | 0.0209355 |
| Decile 2 | 0.0168978 |
| Decile 1 | 0.012206 |
| Minimum | 0.00010499 |
|

|
- Mean = 0.029422
- Std.dev = 0.0142863
- 22 items above graph maximum of 0.08505
|


