Data
507,960 items of data are available, covering 488,512 participants.
Defined-instances run from 0 to 1, labelled using Instancing
2.
Units of measurement are mmol/l.
| Maximum | 2.4435 |
| Decile 9 | 0.60158 |
| Decile 8 | 0.495018 |
| Decile 7 | 0.42276 |
| Decile 6 | 0.363987 |
| Median | 0.31268 |
| Decile 4 | 0.26561 |
| Decile 3 | 0.220896 |
| Decile 2 | 0.17623 |
| Decile 1 | 0.12716 |
| Minimum | 0.000373545 |
|

|
- Mean = 0.344146
- Std.dev = 0.191104
- 1362 items above graph maximum of 1.076
|
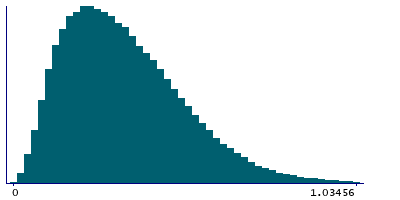
2 Instances
Instance 0 : Initial assessment visit (2006-2010) at which participants were recruited and consent given
488,083 participants, 488,083 items
| Maximum | 2.4435 |
| Decile 9 | 0.602622 |
| Decile 8 | 0.495979 |
| Decile 7 | 0.423423 |
| Decile 6 | 0.364487 |
| Median | 0.31302 |
| Decile 4 | 0.265811 |
| Decile 3 | 0.22093 |
| Decile 2 | 0.176154 |
| Decile 1 | 0.12704 |
| Minimum | 0.000373545 |
|
|
- Mean = 0.344559
- Std.dev = 0.191544
- 1309 items above graph maximum of 1.0782
|
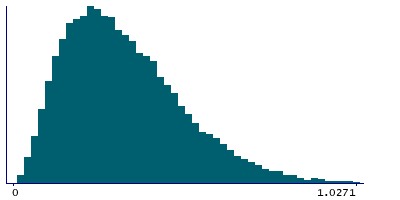
Instance 1 : First repeat assessment visit (2012-13)
19,877 participants, 19,877 items
| Maximum | 1.8502 |
| Decile 9 | 0.57734 |
| Decile 8 | 0.472818 |
| Decile 7 | 0.407905 |
| Decile 6 | 0.352446 |
| Median | 0.305333 |
| Decile 4 | 0.26111 |
| Decile 3 | 0.22018 |
| Decile 2 | 0.17787 |
| Decile 1 | 0.129982 |
| Minimum | 0.0046772 |
|
|
- Mean = 0.333994
- Std.dev = 0.17966
- 46 items above graph maximum of 1.0247
|


