Data
507,960 items of data are available, covering 488,512 participants.
Defined-instances run from 0 to 1, labelled using Instancing
2.
Units of measurement are mmol/l.
| Maximum | 1.94522 |
| Decile 9 | 0.6034 |
| Decile 8 | 0.53219 |
| Decile 7 | 0.48396 |
| Decile 6 | 0.44479 |
| Median | 0.40983 |
| Decile 4 | 0.376513 |
| Decile 3 | 0.34263 |
| Decile 2 | 0.30581 |
| Decile 1 | 0.25959 |
| Minimum | 0.049596 |
|

|
- Mean = 0.423529
- Std.dev = 0.136665
- 924 items above graph maximum of 0.94721
|
2 Instances
Instance 0 : Initial assessment visit (2006-2010) at which participants were recruited and consent given
488,083 participants, 488,083 items
| Maximum | 1.94522 |
| Decile 9 | 0.60407 |
| Decile 8 | 0.532742 |
| Decile 7 | 0.484483 |
| Decile 6 | 0.445175 |
| Median | 0.410091 |
| Decile 4 | 0.376679 |
| Decile 3 | 0.3427 |
| Decile 2 | 0.30583 |
| Decile 1 | 0.25948 |
| Minimum | 0.049596 |
|

|
- Mean = 0.423843
- Std.dev = 0.136998
- 894 items above graph maximum of 0.94866
|
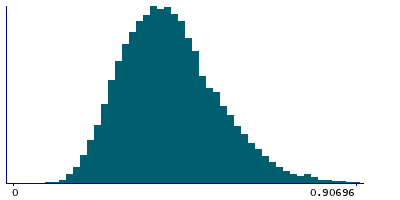
Instance 1 : First repeat assessment visit (2012-13)
19,877 participants, 19,877 items
| Maximum | 1.46346 |
| Decile 9 | 0.585135 |
| Decile 8 | 0.5184 |
| Decile 7 | 0.4715 |
| Decile 6 | 0.435857 |
| Median | 0.404101 |
| Decile 4 | 0.37275 |
| Decile 3 | 0.34086 |
| Decile 2 | 0.305232 |
| Decile 1 | 0.262311 |
| Minimum | 0.08616 |
|
|
- Mean = 0.415828
- Std.dev = 0.127984
- 27 items above graph maximum of 0.907959
|


