Data
507,960 items of data are available, covering 488,512 participants.
Defined-instances run from 0 to 1, labelled using Instancing
2.
Units of measurement are mmol/l.
| Maximum | 0.42004 |
| Decile 9 | 0.1436 |
| Decile 8 | 0.12636 |
| Decile 7 | 0.114633 |
| Decile 6 | 0.105055 |
| Median | 0.096481 |
| Decile 4 | 0.088253 |
| Decile 3 | 0.0797922 |
| Decile 2 | 0.070573 |
| Decile 1 | 0.0588685 |
| Minimum | 0.000344985 |
|
|
- Mean = 0.0994279
- Std.dev = 0.0336262
- 785 items above graph maximum of 0.228331
|
2 Instances
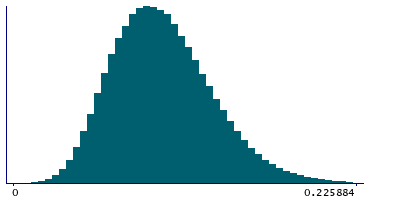
Instance 0 : Initial assessment visit (2006-2010) at which participants were recruited and consent given
488,083 participants, 488,083 items
| Maximum | 0.42004 |
| Decile 9 | 0.14374 |
| Decile 8 | 0.12651 |
| Decile 7 | 0.114758 |
| Decile 6 | 0.10518 |
| Median | 0.0965959 |
| Decile 4 | 0.0883468 |
| Decile 3 | 0.0798868 |
| Decile 2 | 0.070647 |
| Decile 1 | 0.0588999 |
| Minimum | 0.000344985 |
|

|
- Mean = 0.099537
- Std.dev = 0.0336771
- 756 items above graph maximum of 0.22858
|
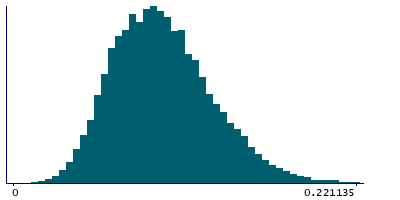
Instance 1 : First repeat assessment visit (2012-13)
19,877 participants, 19,877 items
| Maximum | 0.364238 |
| Decile 9 | 0.13983 |
| Decile 8 | 0.122577 |
| Decile 7 | 0.111265 |
| Decile 6 | 0.10207 |
| Median | 0.0938475 |
| Decile 4 | 0.0860265 |
| Decile 3 | 0.0776001 |
| Decile 2 | 0.0688105 |
| Decile 1 | 0.058161 |
| Minimum | 0.0054182 |
|
|
- Mean = 0.0967502
- Std.dev = 0.0322357
- 25 items above graph maximum of 0.221499
|


