Data
507,960 items of data are available, covering 488,512 participants.
Defined-instances run from 0 to 1, labelled using Instancing
2.
Units of measurement are mmol/l.
| Maximum | 1.07285 |
| Decile 9 | 0.250283 |
| Decile 8 | 0.21431 |
| Decile 7 | 0.19088 |
| Decile 6 | 0.17226 |
| Median | 0.15572 |
| Decile 4 | 0.14009 |
| Decile 3 | 0.12458 |
| Decile 2 | 0.1082 |
| Decile 1 | 0.089023 |
| Minimum | 0.0021417 |
|

|
- Mean = 0.164595
- Std.dev = 0.0653775
- 1690 items above graph maximum of 0.411542
|
2 Instances
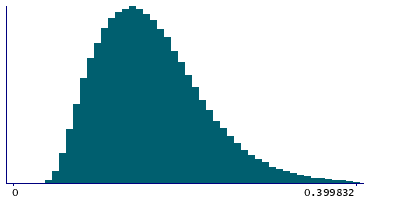
Instance 0 : Initial assessment visit (2006-2010) at which participants were recruited and consent given
488,083 participants, 488,083 items
| Maximum | 1.07285 |
| Decile 9 | 0.25072 |
| Decile 8 | 0.21455 |
| Decile 7 | 0.19101 |
| Decile 6 | 0.17235 |
| Median | 0.155733 |
| Decile 4 | 0.14005 |
| Decile 3 | 0.124482 |
| Decile 2 | 0.108087 |
| Decile 1 | 0.088875 |
| Minimum | 0.0021417 |
|
|
- Mean = 0.164672
- Std.dev = 0.0655897
- 1622 items above graph maximum of 0.412565
|
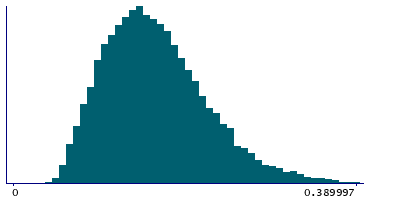
Instance 1 : First repeat assessment visit (2012-13)
19,877 participants, 19,877 items
| Maximum | 0.60302 |
| Decile 9 | 0.241331 |
| Decile 8 | 0.208577 |
| Decile 7 | 0.187445 |
| Decile 6 | 0.170698 |
| Median | 0.155362 |
| Decile 4 | 0.14084 |
| Decile 3 | 0.126865 |
| Decile 2 | 0.111095 |
| Decile 1 | 0.0926643 |
| Minimum | 0.0322697 |
|
|
- Mean = 0.162704
- Std.dev = 0.0599008
- 56 items above graph maximum of 0.389997
|


