Data
507,960 items of data are available, covering 488,512 participants.
Defined-instances run from 0 to 1, labelled using Instancing
2.
Units of measurement are mmol/l.
| Maximum | 1.1969 |
| Decile 9 | 0.471074 |
| Decile 8 | 0.43051 |
| Decile 7 | 0.40306 |
| Decile 6 | 0.37995 |
| Median | 0.35883 |
| Decile 4 | 0.33817 |
| Decile 3 | 0.31638 |
| Decile 2 | 0.29165 |
| Decile 1 | 0.25866 |
| Minimum | 0.0546524 |
|
|
- Mean = 0.36273
- Std.dev = 0.0839492
- 524 items above graph maximum of 0.683488
|
2 Instances
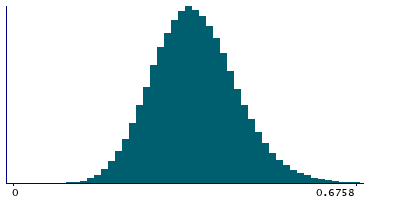
Instance 0 : Initial assessment visit (2006-2010) at which participants were recruited and consent given
488,083 participants, 488,083 items
| Maximum | 1.1969 |
| Decile 9 | 0.47129 |
| Decile 8 | 0.430742 |
| Decile 7 | 0.40325 |
| Decile 6 | 0.38016 |
| Median | 0.35905 |
| Decile 4 | 0.33845 |
| Decile 3 | 0.316646 |
| Decile 2 | 0.291987 |
| Decile 1 | 0.25902 |
| Minimum | 0.0546524 |
|

|
- Mean = 0.362979
- Std.dev = 0.0838926
- 495 items above graph maximum of 0.68356
|
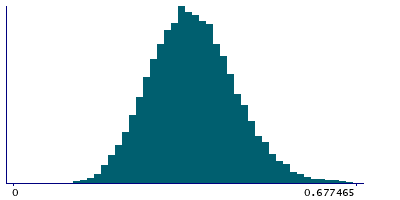
Instance 1 : First repeat assessment visit (2012-13)
19,877 participants, 19,877 items
| Maximum | 0.854854 |
| Decile 9 | 0.465515 |
| Decile 8 | 0.425235 |
| Decile 7 | 0.397735 |
| Decile 6 | 0.374624 |
| Median | 0.352765 |
| Decile 4 | 0.331881 |
| Decile 3 | 0.30962 |
| Decile 2 | 0.28398 |
| Decile 1 | 0.251 |
| Minimum | 0.080442 |
|
|
- Mean = 0.356621
- Std.dev = 0.0851002
- 30 items above graph maximum of 0.68003
|


