Data
507,960 items of data are available, covering 488,512 participants.
Defined-instances run from 0 to 1, labelled using Instancing
2.
Units of measurement are mmol/l.
| Maximum | 1.44619 |
| Decile 9 | 0.59249 |
| Decile 8 | 0.53331 |
| Decile 7 | 0.492328 |
| Decile 6 | 0.45879 |
| Median | 0.42845 |
| Decile 4 | 0.39892 |
| Decile 3 | 0.36818 |
| Decile 2 | 0.33354 |
| Decile 1 | 0.288176 |
| Minimum | 3.05544e-14 |
|
|
- Mean = 0.435794
- Std.dev = 0.120248
- 469 items above graph maximum of 0.896804
|
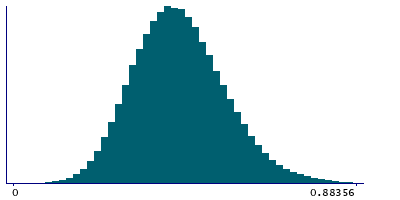
2 Instances
Instance 0 : Initial assessment visit (2006-2010) at which participants were recruited and consent given
488,083 participants, 488,083 items
| Maximum | 1.44619 |
| Decile 9 | 0.59298 |
| Decile 8 | 0.53365 |
| Decile 7 | 0.49266 |
| Decile 6 | 0.459127 |
| Median | 0.42882 |
| Decile 4 | 0.39924 |
| Decile 3 | 0.368521 |
| Decile 2 | 0.33387 |
| Decile 1 | 0.288467 |
| Minimum | 3.05544e-14 |
|

|
- Mean = 0.436144
- Std.dev = 0.120299
- 451 items above graph maximum of 0.897493
|
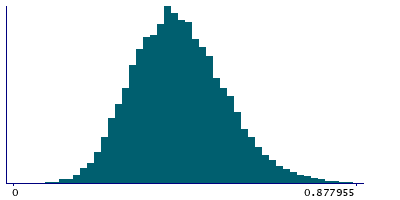
Instance 1 : First repeat assessment visit (2012-13)
19,877 participants, 19,877 items
| Maximum | 1.08621 |
| Decile 9 | 0.5796 |
| Decile 8 | 0.524194 |
| Decile 7 | 0.484098 |
| Decile 6 | 0.45039 |
| Median | 0.420203 |
| Decile 4 | 0.392 |
| Decile 3 | 0.35986 |
| Decile 2 | 0.324955 |
| Decile 1 | 0.28119 |
| Minimum | 0.055215 |
|
|
- Mean = 0.427194
- Std.dev = 0.118669
- 26 items above graph maximum of 0.87801
|


