Data
507,960 items of data are available, covering 488,512 participants.
Defined-instances run from 0 to 1, labelled using Instancing
2.
Units of measurement are mmol/l.
| Maximum | 0.230854 |
| Decile 9 | 0.0477732 |
| Decile 8 | 0.040967 |
| Decile 7 | 0.0369324 |
| Decile 6 | 0.033992 |
| Median | 0.031591 |
| Decile 4 | 0.0294506 |
| Decile 3 | 0.0274113 |
| Decile 2 | 0.025282 |
| Decile 1 | 0.022649 |
| Minimum | 0.00062251 |
|

|
- Mean = 0.0337868
- Std.dev = 0.0108284
- 3594 items above graph maximum of 0.0728973
|
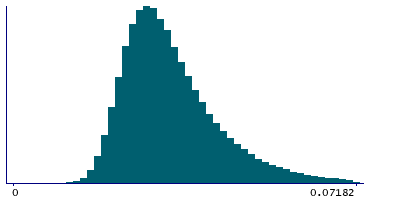
2 Instances
Instance 0 : Initial assessment visit (2006-2010) at which participants were recruited and consent given
488,083 participants, 488,083 items
| Maximum | 0.230854 |
| Decile 9 | 0.0478757 |
| Decile 8 | 0.0410311 |
| Decile 7 | 0.0369746 |
| Decile 6 | 0.034013 |
| Median | 0.0315961 |
| Decile 4 | 0.029446 |
| Decile 3 | 0.0274006 |
| Decile 2 | 0.025267 |
| Decile 1 | 0.022633 |
| Minimum | 0.00062251 |
|
|
- Mean = 0.0338136
- Std.dev = 0.01088
- 3462 items above graph maximum of 0.0731184
|
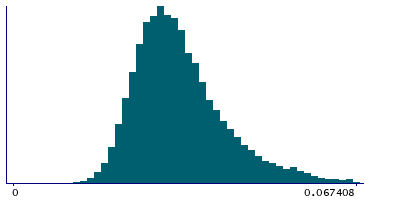
Instance 1 : First repeat assessment visit (2012-13)
19,877 participants, 19,877 items
| Maximum | 0.133102 |
| Decile 9 | 0.045249 |
| Decile 8 | 0.039493 |
| Decile 7 | 0.036051 |
| Decile 6 | 0.033527 |
| Median | 0.0314757 |
| Decile 4 | 0.0295515 |
| Decile 3 | 0.0276538 |
| Decile 2 | 0.0256573 |
| Decile 1 | 0.0231355 |
| Minimum | 0.010119 |
|
|
- Mean = 0.0331296
- Std.dev = 0.00945056
- 130 items above graph maximum of 0.0673625
|


