Data
507,960 items of data are available, covering 488,512 participants.
Defined-instances run from 0 to 1, labelled using Instancing
2.
Units of measurement are mmol/l.
| Maximum | 0.177799 |
| Decile 9 | 0.066807 |
| Decile 8 | 0.0608422 |
| Decile 7 | 0.0567078 |
| Decile 6 | 0.0532434 |
| Median | 0.0500866 |
| Decile 4 | 0.04693 |
| Decile 3 | 0.0436129 |
| Decile 2 | 0.0397858 |
| Decile 1 | 0.03447 |
| Minimum | 1.87956e-14 |
|
|
- Mean = 0.0504253
- Std.dev = 0.0128823
- 372 items above graph maximum of 0.099144
|
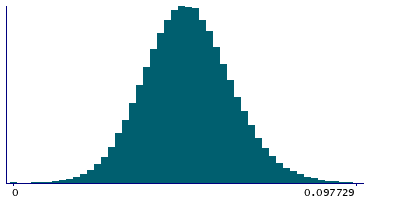
2 Instances
Instance 0 : Initial assessment visit (2006-2010) at which participants were recruited and consent given
488,083 participants, 488,083 items
| Maximum | 0.177799 |
| Decile 9 | 0.066841 |
| Decile 8 | 0.0608775 |
| Decile 7 | 0.0567457 |
| Decile 6 | 0.0532767 |
| Median | 0.050119 |
| Decile 4 | 0.0469654 |
| Decile 3 | 0.04365 |
| Decile 2 | 0.039823 |
| Decile 1 | 0.034503 |
| Minimum | 1.87956e-14 |
|

|
- Mean = 0.0504587
- Std.dev = 0.012888
- 355 items above graph maximum of 0.0991791
|
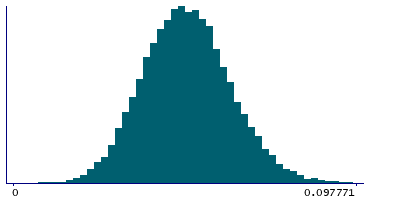
Instance 1 : First repeat assessment visit (2012-13)
19,877 participants, 19,877 items
| Maximum | 0.120603 |
| Decile 9 | 0.0659106 |
| Decile 8 | 0.059865 |
| Decile 7 | 0.0557965 |
| Decile 6 | 0.0524665 |
| Median | 0.0492416 |
| Decile 4 | 0.0460336 |
| Decile 3 | 0.0427261 |
| Decile 2 | 0.0388524 |
| Decile 1 | 0.0337245 |
| Minimum | 0.00026592 |
|
|
- Mean = 0.0496053
- Std.dev = 0.0127134
- 19 items above graph maximum of 0.0980966
|


