Data
507,960 items of data are available, covering 488,512 participants.
Defined-instances run from 0 to 1, labelled using Instancing
2.
Units of measurement are mmol/l.
| Maximum | 1.0546 |
| Decile 9 | 0.27602 |
| Decile 8 | 0.22161 |
| Decile 7 | 0.18841 |
| Decile 6 | 0.16494 |
| Median | 0.146929 |
| Decile 4 | 0.131413 |
| Decile 3 | 0.11692 |
| Decile 2 | 0.101433 |
| Decile 1 | 0.0815884 |
| Minimum | 0.0016173 |
|
|
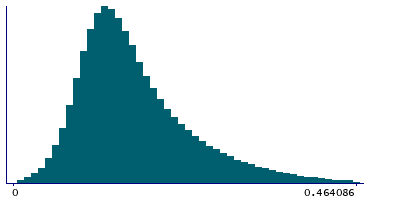
- Mean = 0.165308
- Std.dev = 0.0821031
- 2685 items above graph maximum of 0.470452
|
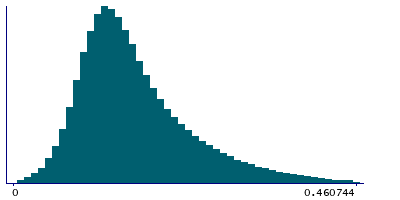
2 Instances
Instance 0 : Initial assessment visit (2006-2010) at which participants were recruited and consent given
488,083 participants, 488,083 items
| Maximum | 1.0546 |
| Decile 9 | 0.274842 |
| Decile 8 | 0.220653 |
| Decile 7 | 0.187699 |
| Decile 6 | 0.16435 |
| Median | 0.14644 |
| Decile 4 | 0.13104 |
| Decile 3 | 0.116656 |
| Decile 2 | 0.1012 |
| Decile 1 | 0.081423 |
| Minimum | 0.0016173 |
|
|
- Mean = 0.164735
- Std.dev = 0.0817569
- 2637 items above graph maximum of 0.468262
|
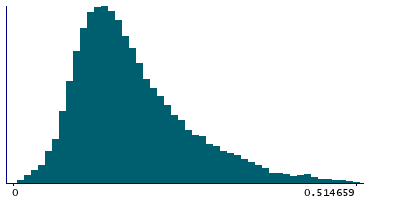
Instance 1 : First repeat assessment visit (2012-13)
19,877 participants, 19,877 items
| Maximum | 0.70234 |
| Decile 9 | 0.303025 |
| Decile 8 | 0.244177 |
| Decile 7 | 0.207721 |
| Decile 6 | 0.18097 |
| Median | 0.159695 |
| Decile 4 | 0.14192 |
| Decile 3 | 0.124995 |
| Decile 2 | 0.107755 |
| Decile 1 | 0.0862277 |
| Minimum | 0.0033321 |
|
|
- Mean = 0.179374
- Std.dev = 0.0890385
- 71 items above graph maximum of 0.519821
|


