Data
507,960 items of data are available, covering 488,512 participants.
Defined-instances run from 0 to 1, labelled using Instancing
2.
Units of measurement are mmol/l.
| Maximum | 1.5885 |
| Decile 9 | 0.545812 |
| Decile 8 | 0.4509 |
| Decile 7 | 0.386907 |
| Decile 6 | 0.33744 |
| Median | 0.2961 |
| Decile 4 | 0.26024 |
| Decile 3 | 0.22737 |
| Decile 2 | 0.195014 |
| Decile 1 | 0.157653 |
| Minimum | 7.3476e-08 |
|
|
- Mean = 0.328238
- Std.dev = 0.15674
- 1110 items above graph maximum of 0.933972
|
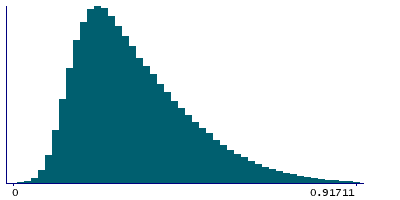
2 Instances
Instance 0 : Initial assessment visit (2006-2010) at which participants were recruited and consent given
488,083 participants, 488,083 items
| Maximum | 1.5885 |
| Decile 9 | 0.54448 |
| Decile 8 | 0.44953 |
| Decile 7 | 0.3857 |
| Decile 6 | 0.33624 |
| Median | 0.29508 |
| Decile 4 | 0.25934 |
| Decile 3 | 0.22665 |
| Decile 2 | 0.194401 |
| Decile 1 | 0.157163 |
| Minimum | 7.3476e-08 |
|

|
- Mean = 0.327273
- Std.dev = 0.156429
- 1087 items above graph maximum of 0.931797
|
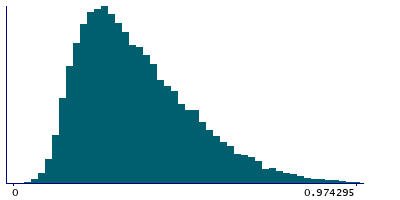
Instance 1 : First repeat assessment visit (2012-13)
19,877 participants, 19,877 items
| Maximum | 1.3629 |
| Decile 9 | 0.576775 |
| Decile 8 | 0.482612 |
| Decile 7 | 0.415954 |
| Decile 6 | 0.366 |
| Median | 0.320365 |
| Decile 4 | 0.2818 |
| Decile 3 | 0.24668 |
| Decile 2 | 0.21131 |
| Decile 1 | 0.171245 |
| Minimum | 1.6137e-05 |
|
|
- Mean = 0.351936
- Std.dev = 0.162397
- 34 items above graph maximum of 0.982305
|


