Data
507,901 items of data are available, covering 488,456 participants.
Defined-instances run from 0 to 1, labelled using Instancing
2.
Units of measurement are percent.
| Maximum | 62.274 |
| Decile 9 | 15.361 |
| Decile 8 | 14.837 |
| Decile 7 | 14.491 |
| Decile 6 | 14.209 |
| Median | 13.9517 |
| Decile 4 | 13.699 |
| Decile 3 | 13.431 |
| Decile 2 | 13.1102 |
| Decile 1 | 12.584 |
| Minimum | 0.079941 |
|

|
- Mean = 13.9082
- Std.dev = 1.43263
- 7664 items below graph minimum of 9.807
- 1954 items above graph maximum of 18.138
|
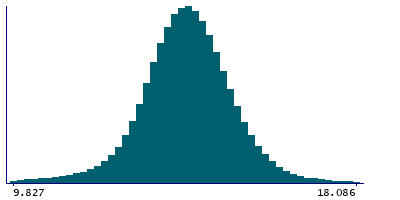
2 Instances
Instance 0 : Initial assessment visit (2006-2010) at which participants were recruited and consent given
488,026 participants, 488,026 items
| Maximum | 62.274 |
| Decile 9 | 15.363 |
| Decile 8 | 14.839 |
| Decile 7 | 14.4933 |
| Decile 6 | 14.212 |
| Median | 13.9542 |
| Decile 4 | 13.7021 |
| Decile 3 | 13.435 |
| Decile 2 | 13.1145 |
| Decile 1 | 12.5897 |
| Minimum | 0.079941 |
|
|
- Mean = 13.9116
- Std.dev = 1.43241
- 7374 items below graph minimum of 9.81646
- 1902 items above graph maximum of 18.1363
|
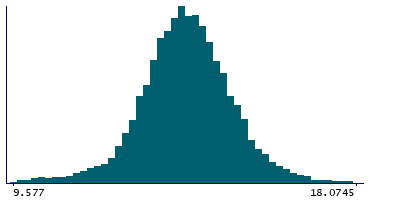
Instance 1 : First repeat assessment visit (2012-13)
19,875 participants, 19,875 items
| Maximum | 27.821 |
| Decile 9 | 15.3179 |
| Decile 8 | 14.792 |
| Decile 7 | 14.428 |
| Decile 6 | 14.146 |
| Median | 13.875 |
| Decile 4 | 13.619 |
| Decile 3 | 13.332 |
| Decile 2 | 12.999 |
| Decile 1 | 12.457 |
| Minimum | 2.37162 |
|
|
- Mean = 13.8243
- Std.dev = 1.43552
- 291 items below graph minimum of 9.5961
- 57 items above graph maximum of 18.1788
|


