Data
507,960 items of data are available, covering 488,512 participants.
Defined-instances run from 0 to 1, labelled using Instancing
2.
Units of measurement are percent.
| Maximum | 27.224 |
| Decile 9 | 15.8213 |
| Decile 8 | 15.186 |
| Decile 7 | 14.69 |
| Decile 6 | 14.2448 |
| Median | 13.806 |
| Decile 4 | 13.352 |
| Decile 3 | 12.8452 |
| Decile 2 | 12.231 |
| Decile 1 | 11.359 |
| Minimum | 0.175334 |
|
|
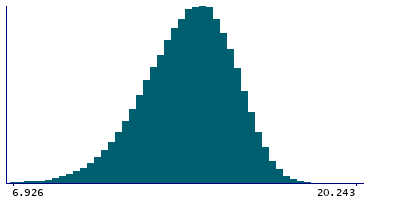
- Mean = 13.6732
- Std.dev = 1.76386
- 703 items below graph minimum of 6.89674
- 33 items above graph maximum of 20.2835
|
2 Instances
Instance 0 : Initial assessment visit (2006-2010) at which participants were recruited and consent given
488,083 participants, 488,083 items
| Maximum | 27.224 |
| Decile 9 | 15.818 |
| Decile 8 | 15.183 |
| Decile 7 | 14.688 |
| Decile 6 | 14.2432 |
| Median | 13.8059 |
| Decile 4 | 13.353 |
| Decile 3 | 12.848 |
| Decile 2 | 12.2336 |
| Decile 1 | 11.3633 |
| Minimum | 0.175334 |
|

|
- Mean = 13.6732
- Std.dev = 1.76102
- 670 items below graph minimum of 6.90866
- 33 items above graph maximum of 20.2727
|
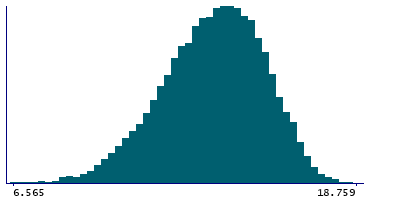
Instance 1 : First repeat assessment visit (2012-13)
19,877 participants, 19,877 items
| Maximum | 19.3857 |
| Decile 9 | 15.9115 |
| Decile 8 | 15.261 |
| Decile 7 | 14.754 |
| Decile 6 | 14.28 |
| Median | 13.8155 |
| Decile 4 | 13.315 |
| Decile 3 | 12.7875 |
| Decile 2 | 12.1675 |
| Decile 1 | 11.26 |
| Minimum | 2.2238 |
|
|
- Mean = 13.6734
- Std.dev = 1.83224
- 28 items below graph minimum of 6.6085
|


