Data
507,960 items of data are available, covering 488,512 participants.
Defined-instances run from 0 to 1, labelled using Instancing
2.
Units of measurement are percent.
| Maximum | 25.935 |
| Decile 9 | 17.0865 |
| Decile 8 | 16.129 |
| Decile 7 | 15.458 |
| Decile 6 | 14.9025 |
| Median | 14.381 |
| Decile 4 | 13.847 |
| Decile 3 | 13.253 |
| Decile 2 | 12.526 |
| Decile 1 | 11.473 |
| Minimum | 1.4919 |
|

|
- Mean = 14.3221
- Std.dev = 2.22808
- 188 items below graph minimum of 5.85946
- 71 items above graph maximum of 22.7001
|
2 Instances
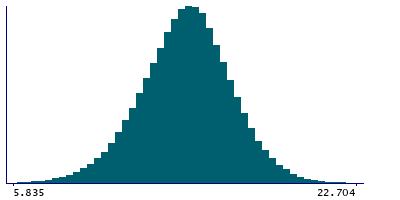
Instance 0 : Initial assessment visit (2006-2010) at which participants were recruited and consent given
488,083 participants, 488,083 items
| Maximum | 25.935 |
| Decile 9 | 17.09 |
| Decile 8 | 16.133 |
| Decile 7 | 15.462 |
| Decile 6 | 14.906 |
| Median | 14.3854 |
| Decile 4 | 13.8515 |
| Decile 3 | 13.2582 |
| Decile 2 | 12.531 |
| Decile 1 | 11.4779 |
| Minimum | 1.4919 |
|
|
- Mean = 14.3262
- Std.dev = 2.22821
- 180 items below graph minimum of 5.8658
- 69 items above graph maximum of 22.7021
|
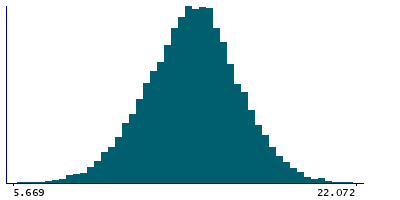
Instance 1 : First repeat assessment visit (2012-13)
19,877 participants, 19,877 items
| Maximum | 24.4709 |
| Decile 9 | 17.008 |
| Decile 8 | 16.0385 |
| Decile 7 | 15.363 |
| Decile 6 | 14.812 |
| Median | 14.272 |
| Decile 4 | 13.73 |
| Decile 3 | 13.1268 |
| Decile 2 | 12.381 |
| Decile 1 | 11.353 |
| Minimum | 4.6858 |
|
|
- Mean = 14.2209
- Std.dev = 2.22249
- 7 items below graph minimum of 5.69801
- 1 item above graph maximum of 22.663
|


