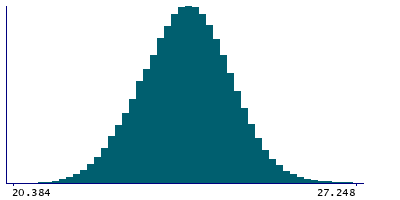
Data
507,960 items of data are available, covering 488,512 participants.
Defined-instances run from 0 to 1, labelled using Instancing
2.
Units of measurement are percent.
| Maximum | 40.799 |
| Decile 9 | 24.923 |
| Decile 8 | 24.54 |
| Decile 7 | 24.2634 |
| Decile 6 | 24.028 |
| Median | 23.806 |
| Decile 4 | 23.581 |
| Decile 3 | 23.3397 |
| Decile 2 | 23.052 |
| Decile 1 | 22.6572 |
| Minimum | 8.2635 |
|

|
- Mean = 23.7997
- Std.dev = 0.900947
- 274 items below graph minimum of 20.3913
- 280 items above graph maximum of 27.1888
|
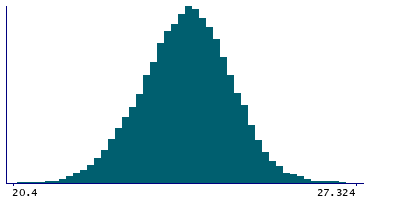
2 Instances
Instance 0 : Initial assessment visit (2006-2010) at which participants were recruited and consent given
488,083 participants, 488,083 items
| Maximum | 40.799 |
| Decile 9 | 24.92 |
| Decile 8 | 24.5367 |
| Decile 7 | 24.26 |
| Decile 6 | 24.025 |
| Median | 23.802 |
| Decile 4 | 23.578 |
| Decile 3 | 23.3363 |
| Decile 2 | 23.049 |
| Decile 1 | 22.656 |
| Minimum | 8.2635 |
|
|
- Mean = 23.7968
- Std.dev = 0.900626
- 268 items below graph minimum of 20.392
- 268 items above graph maximum of 27.184
|
Instance 1 : First repeat assessment visit (2012-13)
19,877 participants, 19,877 items
| Maximum | 29.531 |
| Decile 9 | 24.994 |
| Decile 8 | 24.618 |
| Decile 7 | 24.345 |
| Decile 6 | 24.108 |
| Median | 23.894 |
| Decile 4 | 23.6659 |
| Decile 3 | 23.422 |
| Decile 2 | 23.129 |
| Decile 1 | 22.699 |
| Minimum | 15.344 |
|
|
- Mean = 23.8715
- Std.dev = 0.905841
- 6 items below graph minimum of 20.404
- 12 items above graph maximum of 27.289
|


