Data
507,960 items of data are available, covering 488,512 participants.
Defined-instances run from 0 to 1, labelled using Instancing
2.
Units of measurement are percent.
| Maximum | 33.133 |
| Decile 9 | 19.02 |
| Decile 8 | 18.616 |
| Decile 7 | 18.311 |
| Decile 6 | 18.0418 |
| Median | 17.7831 |
| Decile 4 | 17.5123 |
| Decile 3 | 17.2105 |
| Decile 2 | 16.836 |
| Decile 1 | 16.2757 |
| Minimum | 5.3787 |
|

|
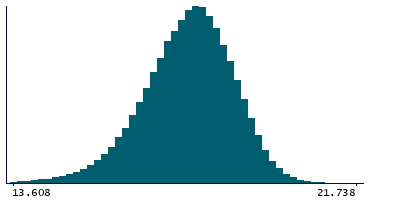
- Mean = 17.6878
- Std.dev = 1.13417
- 2181 items below graph minimum of 13.5314
- 13 items above graph maximum of 21.7643
|
2 Instances
Instance 0 : Initial assessment visit (2006-2010) at which participants were recruited and consent given
488,083 participants, 488,083 items
| Maximum | 33.133 |
| Decile 9 | 19.012 |
| Decile 8 | 18.609 |
| Decile 7 | 18.306 |
| Decile 6 | 18.0376 |
| Median | 17.779 |
| Decile 4 | 17.5087 |
| Decile 3 | 17.2065 |
| Decile 2 | 16.8326 |
| Decile 1 | 16.271 |
| Minimum | 5.3787 |
|
|
- Mean = 17.6826
- Std.dev = 1.13321
- 2119 items below graph minimum of 13.53
- 14 items above graph maximum of 21.753
|
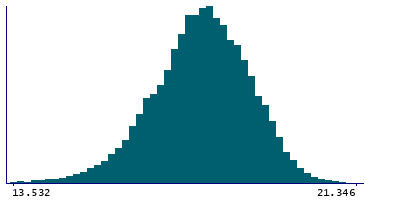
Instance 1 : First repeat assessment visit (2012-13)
19,877 participants, 19,877 items
| Maximum | 21.346 |
| Decile 9 | 19.221 |
| Decile 8 | 18.781 |
| Decile 7 | 18.445 |
| Decile 6 | 18.151 |
| Median | 17.886 |
| Decile 4 | 17.607 |
| Decile 3 | 17.3121 |
| Decile 2 | 16.928 |
| Decile 1 | 16.3745 |
| Minimum | 8.7423 |
|
|
- Mean = 17.8168
- Std.dev = 1.15
- 60 items below graph minimum of 13.528
|


