Data
507,960 items of data are available, covering 488,512 participants.
Defined-instances run from 0 to 1, labelled using Instancing
2.
Units of measurement are percent.
| Maximum | 37.4398 |
| Decile 9 | 11.5845 |
| Decile 8 | 10.044 |
| Decile 7 | 9.1364 |
| Decile 6 | 8.4703 |
| Median | 7.92789 |
| Decile 4 | 7.45739 |
| Decile 3 | 7.0083 |
| Decile 2 | 6.54302 |
| Decile 1 | 5.9772 |
| Minimum | 2.2594 |
|

|
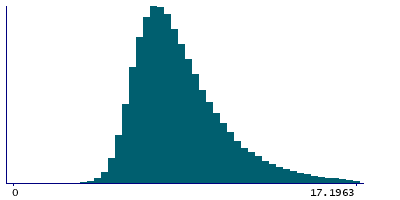
- Mean = 8.47133
- Std.dev = 2.52483
- 5371 items above graph maximum of 17.1918
|
2 Instances
Instance 0 : Initial assessment visit (2006-2010) at which participants were recruited and consent given
488,083 participants, 488,083 items
| Maximum | 37.4398 |
| Decile 9 | 11.5868 |
| Decile 8 | 10.0421 |
| Decile 7 | 9.1329 |
| Decile 6 | 8.46733 |
| Median | 7.92358 |
| Decile 4 | 7.4537 |
| Decile 3 | 7.00474 |
| Decile 2 | 6.5387 |
| Decile 1 | 5.97337 |
| Minimum | 2.2594 |
|
|
- Mean = 8.46951
- Std.dev = 2.52965
- 5200 items above graph maximum of 17.2003
|
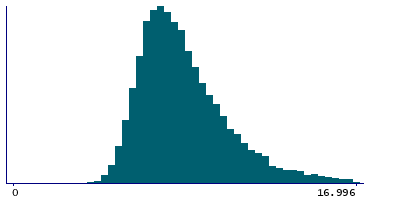
Instance 1 : First repeat assessment visit (2012-13)
19,877 participants, 19,877 items
| Maximum | 31.5098 |
| Decile 9 | 11.5257 |
| Decile 8 | 10.079 |
| Decile 7 | 9.2156 |
| Decile 6 | 8.5565 |
| Median | 8.0246 |
| Decile 4 | 7.55336 |
| Decile 3 | 7.10163 |
| Decile 2 | 6.6412 |
| Decile 1 | 6.0738 |
| Minimum | 3.08232 |
|
|
- Mean = 8.51601
- Std.dev = 2.40294
- 165 items above graph maximum of 16.9777
|


