Data
507,960 items of data are available, covering 488,512 participants.
Defined-instances run from 0 to 1, labelled using Instancing
2.
Units of measurement are percent.
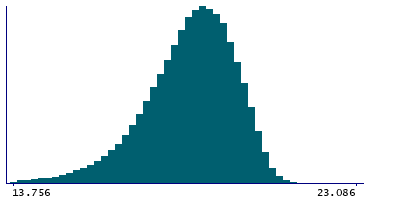
| Maximum | 28.28 |
| Decile 9 | 19.945 |
| Decile 8 | 19.5562 |
| Decile 7 | 19.244 |
| Decile 6 | 18.956 |
| Median | 18.6703 |
| Decile 4 | 18.368 |
| Decile 3 | 18.0147 |
| Decile 2 | 17.5615 |
| Decile 1 | 16.8421 |
| Minimum | 0 |
|
|
- Mean = 18.4849
- Std.dev = 1.32957
- 3166 items below graph minimum of 13.7392
- 1 item above graph maximum of 23.0479
|
2 Instances
Instance 0 : Initial assessment visit (2006-2010) at which participants were recruited and consent given
488,083 participants, 488,083 items
| Maximum | 28.28 |
| Decile 9 | 19.9436 |
| Decile 8 | 19.556 |
| Decile 7 | 19.244 |
| Decile 6 | 18.957 |
| Median | 18.671 |
| Decile 4 | 18.369 |
| Decile 3 | 18.016 |
| Decile 2 | 17.562 |
| Decile 1 | 16.84 |
| Minimum | 0 |
|

|
- Mean = 18.4844
- Std.dev = 1.33117
- 3071 items below graph minimum of 13.7364
- 1 item above graph maximum of 23.0471
|
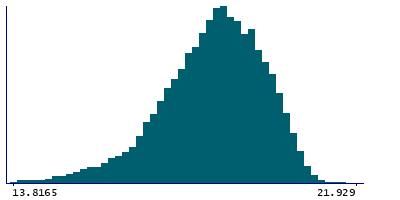
Instance 1 : First repeat assessment visit (2012-13)
19,877 participants, 19,877 items
| Maximum | 21.929 |
| Decile 9 | 19.974 |
| Decile 8 | 19.568 |
| Decile 7 | 19.243 |
| Decile 6 | 18.9403 |
| Median | 18.6535 |
| Decile 4 | 18.348 |
| Decile 3 | 17.991 |
| Decile 2 | 17.55 |
| Decile 1 | 16.8983 |
| Minimum | 0.68107 |
|
|
- Mean = 18.4973
- Std.dev = 1.2897
- 93 items below graph minimum of 13.8226
|


