Data
507,960 items of data are available, covering 488,512 participants.
Defined-instances run from 0 to 1, labelled using Instancing
2.
Units of measurement are percent.
| Maximum | 84.1214 |
| Decile 9 | 33.452 |
| Decile 8 | 32.607 |
| Decile 7 | 32.04 |
| Decile 6 | 31.5832 |
| Median | 31.167 |
| Decile 4 | 30.759 |
| Decile 3 | 30.3348 |
| Decile 2 | 29.8426 |
| Decile 1 | 29.162 |
| Minimum | 0.0004746 |
|

|
- Mean = 31.2444
- Std.dev = 1.77551
- 751 items below graph minimum of 24.872
- 905 items above graph maximum of 37.742
|
2 Instances
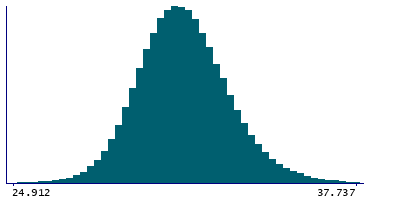
Instance 0 : Initial assessment visit (2006-2010) at which participants were recruited and consent given
488,083 participants, 488,083 items
| Maximum | 84.1214 |
| Decile 9 | 33.4446 |
| Decile 8 | 32.602 |
| Decile 7 | 32.035 |
| Decile 6 | 31.5785 |
| Median | 31.1626 |
| Decile 4 | 30.754 |
| Decile 3 | 30.3299 |
| Decile 2 | 29.8371 |
| Decile 1 | 29.156 |
| Minimum | 0.0004746 |
|
|
- Mean = 31.2389
- Std.dev = 1.77537
- 720 items below graph minimum of 24.8674
- 873 items above graph maximum of 37.7332
|
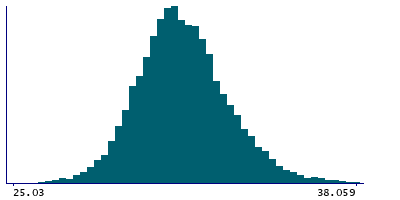
Instance 1 : First repeat assessment visit (2012-13)
19,877 participants, 19,877 items
| Maximum | 41.766 |
| Decile 9 | 33.6305 |
| Decile 8 | 32.727 |
| Decile 7 | 32.167 |
| Decile 6 | 31.707 |
| Median | 31.273 |
| Decile 4 | 30.877 |
| Decile 3 | 30.462 |
| Decile 2 | 29.966 |
| Decile 1 | 29.3015 |
| Minimum | 16.158 |
|
|
- Mean = 31.3799
- Std.dev = 1.77354
- 28 items below graph minimum of 24.9725
- 35 items above graph maximum of 37.9595
|


