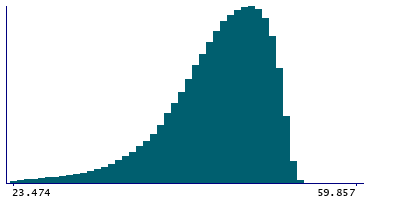
Data
507,721 items of data are available, covering 488,283 participants.
Defined-instances run from 0 to 1, labelled using Instancing
2.
Units of measurement are percent.
| Maximum | 63.6116 |
| Decile 9 | 50.842 |
| Decile 8 | 49.5082 |
| Decile 7 | 48.2617 |
| Decile 6 | 47.002 |
| Median | 45.684 |
| Decile 4 | 44.2305 |
| Decile 3 | 42.537 |
| Decile 2 | 40.281 |
| Decile 1 | 36.347 |
| Minimum | 1.1777e-05 |
|
|
- Mean = 44.1395
- Std.dev = 7.22048
- 8964 items below graph minimum of 21.852
|
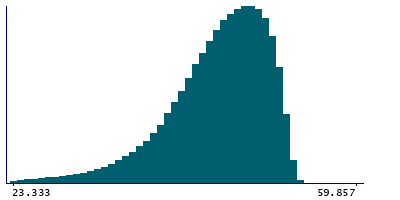
2 Instances
Instance 0 : Initial assessment visit (2006-2010) at which participants were recruited and consent given
487,850 participants, 487,850 items
| Maximum | 63.6116 |
| Decile 9 | 50.8233 |
| Decile 8 | 49.481 |
| Decile 7 | 48.225 |
| Decile 6 | 46.961 |
| Median | 45.635 |
| Decile 4 | 44.181 |
| Decile 3 | 42.483 |
| Decile 2 | 40.22 |
| Decile 1 | 36.283 |
| Minimum | 5.3076e-05 |
|
|
- Mean = 44.0932
- Std.dev = 7.23736
- 8614 items below graph minimum of 21.7427
|
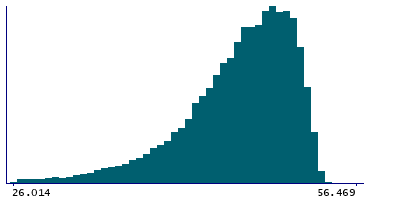
Instance 1 : First repeat assessment visit (2012-13)
19,871 participants, 19,871 items
| Maximum | 56.469 |
| Decile 9 | 51.2305 |
| Decile 8 | 50.121 |
| Decile 7 | 49.0328 |
| Decile 6 | 47.975 |
| Median | 46.765 |
| Decile 4 | 45.4945 |
| Decile 3 | 43.9355 |
| Decile 2 | 41.877 |
| Decile 1 | 38.2205 |
| Minimum | 1.1777e-05 |
|
|
- Mean = 45.2766
- Std.dev = 6.69294
- 336 items below graph minimum of 25.2106
|


