Data
507,960 items of data are available, covering 488,512 participants.
Defined-instances run from 0 to 1, labelled using Instancing
2.
Units of measurement are percent.
| Maximum | 83.8678 |
| Decile 9 | 54.6215 |
| Decile 8 | 52.749 |
| Decile 7 | 51.631 |
| Decile 6 | 50.794 |
| Median | 50.09 |
| Decile 4 | 49.455 |
| Decile 3 | 48.845 |
| Decile 2 | 48.258 |
| Decile 1 | 47.622 |
| Minimum | 0.000208496 |
|
|
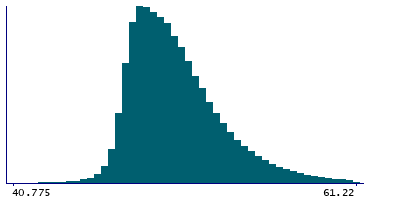
- Mean = 50.7028
- Std.dev = 3.16795
- 345 items below graph minimum of 40.6225
- 4560 items above graph maximum of 61.621
|
2 Instances
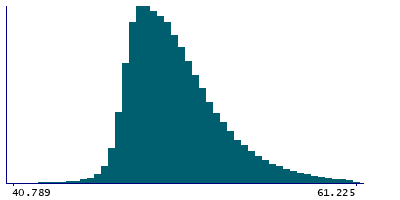
Instance 0 : Initial assessment visit (2006-2010) at which participants were recruited and consent given
488,083 participants, 488,083 items
| Maximum | 83.8678 |
| Decile 9 | 54.6323 |
| Decile 8 | 52.7615 |
| Decile 7 | 51.643 |
| Decile 6 | 50.8046 |
| Median | 50.102 |
| Decile 4 | 49.4678 |
| Decile 3 | 48.857 |
| Decile 2 | 48.2682 |
| Decile 1 | 47.631 |
| Minimum | 0.000208496 |
|
|
- Mean = 50.7133
- Std.dev = 3.16939
- 339 items below graph minimum of 40.6297
- 4353 items above graph maximum of 61.6336
|
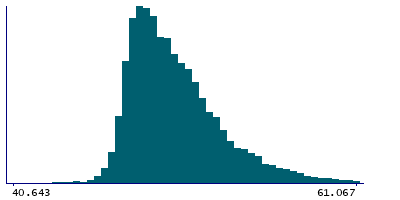
Instance 1 : First repeat assessment visit (2012-13)
19,877 participants, 19,877 items
| Maximum | 80.966 |
| Decile 9 | 54.3735 |
| Decile 8 | 52.442 |
| Decile 7 | 51.3285 |
| Decile 6 | 50.497 |
| Median | 49.78 |
| Decile 4 | 49.128 |
| Decile 3 | 48.558 |
| Decile 2 | 48.032 |
| Decile 1 | 47.4375 |
| Minimum | 0.044574 |
|
|
- Mean = 50.4444
- Std.dev = 3.12134
- 6 items below graph minimum of 40.5015
- 185 items above graph maximum of 61.3095
|


