Data
507,960 items of data are available, covering 488,512 participants.
Defined-instances run from 0 to 1, labelled using Instancing
2.
Units of measurement are percent.
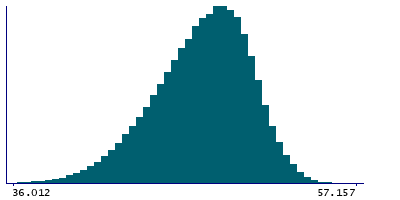
| Maximum | 57.157 |
| Decile 9 | 51.2001 |
| Decile 8 | 50.21 |
| Decile 7 | 49.434 |
| Decile 6 | 48.703 |
| Median | 47.958 |
| Decile 4 | 47.1553 |
| Decile 3 | 46.239 |
| Decile 2 | 45.113 |
| Decile 1 | 43.4788 |
| Minimum | 0.00054536 |
|
|
- Mean = 47.6046
- Std.dev = 3.06381
- 566 items below graph minimum of 35.7576
|
2 Instances
Instance 0 : Initial assessment visit (2006-2010) at which participants were recruited and consent given
488,083 participants, 488,083 items
| Maximum | 57.157 |
| Decile 9 | 51.1941 |
| Decile 8 | 50.204 |
| Decile 7 | 49.427 |
| Decile 6 | 48.6939 |
| Median | 47.945 |
| Decile 4 | 47.14 |
| Decile 3 | 46.2221 |
| Decile 2 | 45.094 |
| Decile 1 | 43.4548 |
| Minimum | 0.00054536 |
|

|
- Mean = 47.5908
- Std.dev = 3.07148
- 542 items below graph minimum of 35.7156
|
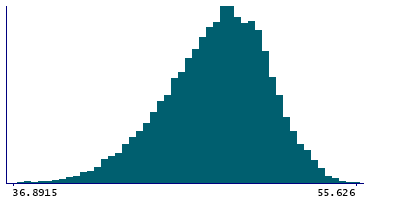
Instance 1 : First repeat assessment visit (2012-13)
19,877 participants, 19,877 items
| Maximum | 56.1633 |
| Decile 9 | 51.3375 |
| Decile 8 | 50.353 |
| Decile 7 | 49.618 |
| Decile 6 | 48.916 |
| Median | 48.2395 |
| Decile 4 | 47.504 |
| Decile 3 | 46.66 |
| Decile 2 | 45.6321 |
| Decile 1 | 44.0911 |
| Minimum | 34.502 |
|
|
- Mean = 47.9437
- Std.dev = 2.84833
- 18 items below graph minimum of 36.8447
|


