Data
507,960 items of data are available, covering 488,512 participants.
Defined-instances run from 0 to 1, labelled using Instancing
2.
Units of measurement are percent.
| Maximum | 49.085 |
| Decile 9 | 42.316 |
| Decile 8 | 41.504 |
| Decile 7 | 40.862 |
| Decile 6 | 40.2595 |
| Median | 39.635 |
| Decile 4 | 38.9484 |
| Decile 3 | 38.1485 |
| Decile 2 | 37.131 |
| Decile 1 | 35.6174 |
| Minimum | 0.00020967 |
|
|
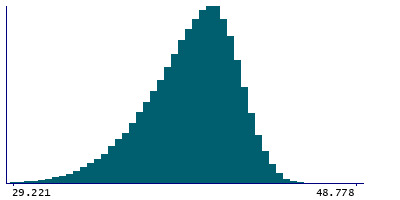
- Mean = 39.2504
- Std.dev = 2.67879
- 819 items below graph minimum of 28.9188
- 1 item above graph maximum of 49.0146
|
2 Instances
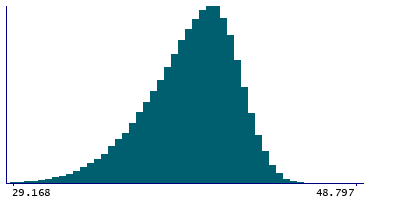
Instance 0 : Initial assessment visit (2006-2010) at which participants were recruited and consent given
488,083 participants, 488,083 items
| Maximum | 49.085 |
| Decile 9 | 42.315 |
| Decile 8 | 41.501 |
| Decile 7 | 40.858 |
| Decile 6 | 40.2534 |
| Median | 39.6266 |
| Decile 4 | 38.937 |
| Decile 3 | 38.1331 |
| Decile 2 | 37.1128 |
| Decile 1 | 35.5946 |
| Minimum | 0.00020967 |
|
|
- Mean = 39.2396
- Std.dev = 2.68772
- 790 items below graph minimum of 28.8741
- 1 item above graph maximum of 49.0354
|
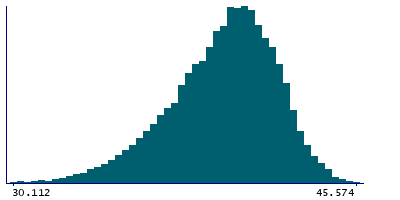
Instance 1 : First repeat assessment visit (2012-13)
19,877 participants, 19,877 items
| Maximum | 45.6363 |
| Decile 9 | 42.3425 |
| Decile 8 | 41.5705 |
| Decile 7 | 40.948 |
| Decile 6 | 40.4005 |
| Median | 39.843 |
| Decile 4 | 39.229 |
| Decile 3 | 38.4875 |
| Decile 2 | 37.6023 |
| Decile 1 | 36.222 |
| Minimum | 25.2589 |
|
|
- Mean = 39.516
- Std.dev = 2.43401
- 30 items below graph minimum of 30.1015
|


