Data
507,960 items of data are available, covering 488,512 participants.
Defined-instances run from 0 to 1, labelled using Instancing
2.
Units of measurement are percent.
| Maximum | 19.0577 |
| Decile 9 | 10.625 |
| Decile 8 | 10.332 |
| Decile 7 | 10.151 |
| Decile 6 | 10.011 |
| Median | 9.8884 |
| Decile 4 | 9.7716 |
| Decile 3 | 9.6532 |
| Decile 2 | 9.52 |
| Decile 1 | 9.3399 |
| Minimum | 0.402456 |
|
|
- Mean = 9.94961
- Std.dev = 0.546927
- 14 items below graph minimum of 8.0548
- 2674 items above graph maximum of 11.9101
|
2 Instances
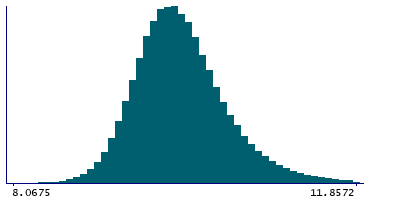
Instance 0 : Initial assessment visit (2006-2010) at which participants were recruited and consent given
488,083 participants, 488,083 items
| Maximum | 19.0577 |
| Decile 9 | 10.621 |
| Decile 8 | 10.33 |
| Decile 7 | 10.15 |
| Decile 6 | 10.01 |
| Median | 9.8879 |
| Decile 4 | 9.77112 |
| Decile 3 | 9.6531 |
| Decile 2 | 9.52039 |
| Decile 1 | 9.3404 |
| Minimum | 0.402456 |
|

|
- Mean = 9.94863
- Std.dev = 0.54567
- 12 items below graph minimum of 8.0598
- 2567 items above graph maximum of 11.9016
|
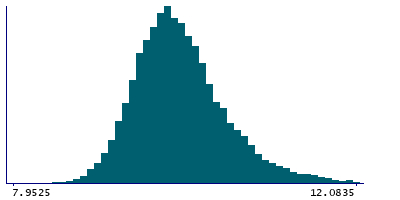
Instance 1 : First repeat assessment visit (2012-13)
19,877 participants, 19,877 items
| Maximum | 14.969 |
| Decile 9 | 10.7075 |
| Decile 8 | 10.382 |
| Decile 7 | 10.183 |
| Decile 6 | 10.031 |
| Median | 9.9005 |
| Decile 4 | 9.7804 |
| Decile 3 | 9.6548 |
| Decile 2 | 9.51095 |
| Decile 1 | 9.3257 |
| Minimum | 7.5826 |
|
|
- Mean = 9.97349
- Std.dev = 0.576426
- 2 items below graph minimum of 7.94392
- 94 items above graph maximum of 12.0893
|


