Data
507,960 items of data are available, covering 488,512 participants.
Defined-instances run from 0 to 1, labelled using Instancing
2.
Units of measurement are percent.
| Maximum | 35.914 |
| Decile 9 | 6.2772 |
| Decile 8 | 5.5922 |
| Decile 7 | 5.1339 |
| Decile 6 | 4.7675 |
| Median | 4.4393 |
| Decile 4 | 4.12 |
| Decile 3 | 3.7841 |
| Decile 2 | 3.40544 |
| Decile 1 | 2.90672 |
| Minimum | 0.073028 |
|

|
- Mean = 4.53744
- Std.dev = 1.35485
- 1015 items above graph maximum of 9.64768
|
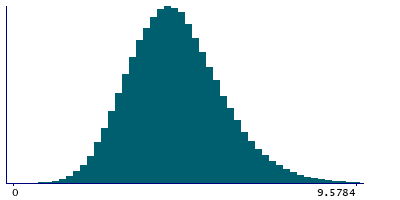
2 Instances
Instance 0 : Initial assessment visit (2006-2010) at which participants were recruited and consent given
488,083 participants, 488,083 items
| Maximum | 35.914 |
| Decile 9 | 6.2866 |
| Decile 8 | 5.5994 |
| Decile 7 | 5.13923 |
| Decile 6 | 4.7716 |
| Median | 4.44267 |
| Decile 4 | 4.1223 |
| Decile 3 | 3.7866 |
| Decile 2 | 3.40676 |
| Decile 1 | 2.90746 |
| Minimum | 0.073028 |
|
|
- Mean = 4.54196
- Std.dev = 1.35862
- 983 items above graph maximum of 9.66574
|
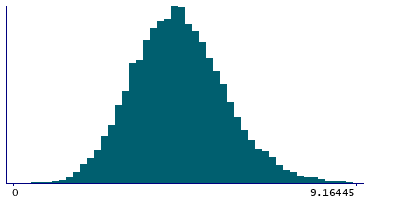
Instance 1 : First repeat assessment visit (2012-13)
19,877 participants, 19,877 items
| Maximum | 12.8681 |
| Decile 9 | 6.02565 |
| Decile 8 | 5.41995 |
| Decile 7 | 5.01155 |
| Decile 6 | 4.6691 |
| Median | 4.3655 |
| Decile 4 | 4.05755 |
| Decile 3 | 3.7357 |
| Decile 2 | 3.36575 |
| Decile 1 | 2.88115 |
| Minimum | 0.149298 |
|
|
- Mean = 4.4265
- Std.dev = 1.25356
- 26 items above graph maximum of 9.17015
|


