Data
8,865 items of data are available, covering 8,865 participants.
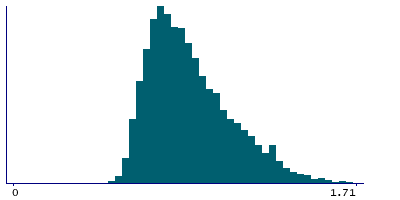
Defined-instances run from 2 to 3, labelled using Instancing
2.
| Maximum | 2 |
| Decile 9 | 1.19 |
| Decile 8 | 1.06 |
| Decile 7 | 0.97 |
| Decile 6 | 0.9 |
| Median | 0.85 |
| Decile 4 | 0.8 |
| Decile 3 | 0.75 |
| Decile 2 | 0.71 |
| Decile 1 | 0.66 |
| Minimum | 0.49 |
|
|
- Mean = 0.889584
- Std.dev = 0.206765
- 4 items above graph maximum of 1.72
|
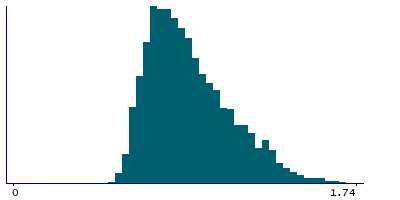
2 Instances
Instance 2 : Imaging visit (2014+)
7,066 participants, 7,066 items
| Maximum | 2 |
| Decile 9 | 1.21 |
| Decile 8 | 1.08 |
| Decile 7 | 0.99 |
| Decile 6 | 0.92 |
| Median | 0.86 |
| Decile 4 | 0.81 |
| Decile 3 | 0.76 |
| Decile 2 | 0.72 |
| Decile 1 | 0.66 |
| Minimum | 0.49 |
|
|
- Mean = 0.900815
- Std.dev = 0.208994
- 3 items above graph maximum of 1.76
|
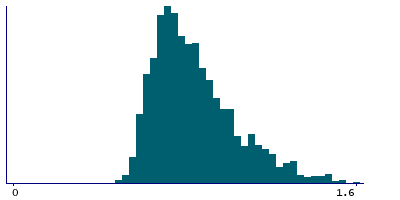
Instance 3 : First repeat imaging visit (2019+)
1,799 participants, 1,799 items
| Maximum | 1.6 |
| Decile 9 | 1.12 |
| Decile 8 | 0.995 |
| Decile 7 | 0.91 |
| Decile 6 | 0.86 |
| Median | 0.81 |
| Decile 4 | 0.76 |
| Decile 3 | 0.72 |
| Decile 2 | 0.68 |
| Decile 1 | 0.63 |
| Minimum | 0.49 |
|
|
- Mean = 0.84547
- Std.dev = 0.191497
|
Notes
Precision-weighted mean ATT (arterial transit time) in the left Putamen
0 Related Data-Fields
There are no related data-fields


