Data
77,958 items of data are available, covering 73,705 participants.
Defined-instances run from 2 to 3, labelled using Instancing
2.
| Maximum | 29.1301 |
| Decile 9 | -2.04118 |
| Decile 8 | -5.57408 |
| Decile 7 | -8.0847 |
| Decile 6 | -10.0732 |
| Median | -11.9448 |
| Decile 4 | -13.7833 |
| Decile 3 | -15.7373 |
| Decile 2 | -18.0099 |
| Decile 1 | -21.1257 |
| Minimum | -99.195 |
|
|
- Mean = -11.7275
- Std.dev = 7.58711
- 17 items below graph minimum of -40.2102
- 57 items above graph maximum of 17.0433
|
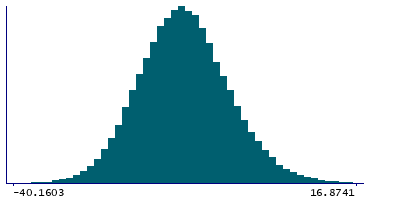
2 Instances
Instance 2 : Imaging visit (2014+)
73,327 participants, 73,327 items
| Maximum | 29.1301 |
| Decile 9 | -2.0137 |
| Decile 8 | -5.55549 |
| Decile 7 | -8.06369 |
| Decile 6 | -10.0588 |
| Median | -11.9234 |
| Decile 4 | -13.7634 |
| Decile 3 | -15.7232 |
| Decile 2 | -17.9937 |
| Decile 1 | -21.1067 |
| Minimum | -99.195 |
|

|
- Mean = -11.7103
- Std.dev = 7.58939
- 17 items below graph minimum of -40.1998
- 53 items above graph maximum of 17.0793
|
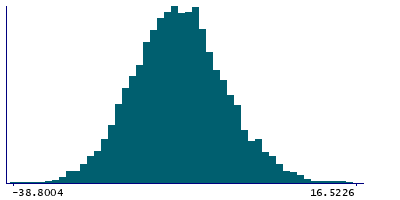
Instance 3 : First repeat imaging visit (2019+)
4,631 participants, 4,631 items
| Maximum | 21.0215 |
| Decile 9 | -2.44905 |
| Decile 8 | -5.84731 |
| Decile 7 | -8.40696 |
| Decile 6 | -10.2815 |
| Median | -12.1942 |
| Decile 4 | -14.0607 |
| Decile 3 | -16.0263 |
| Decile 2 | -18.3457 |
| Decile 1 | -21.4076 |
| Minimum | -38.8004 |
|
|
- Mean = -12.0004
- Std.dev = 7.54556
- 5 items above graph maximum of 16.5095
|
Notes
Median magnetic susceptibility in left thalamus (from QSM processing of SWI data)
0 Related Data-Fields
There are no related data-fields


