Data
77,958 items of data are available, covering 73,705 participants.
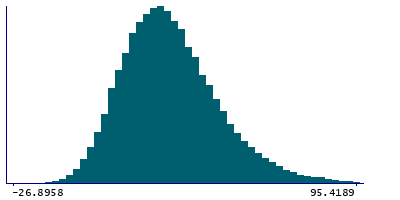
Defined-instances run from 2 to 3, labelled using Instancing
2.
| Maximum | 184.203 |
| Decile 9 | 54.1295 |
| Decile 8 | 44.2718 |
| Decile 7 | 37.893 |
| Decile 6 | 32.8347 |
| Median | 28.4262 |
| Decile 4 | 24.2833 |
| Decile 3 | 20.0529 |
| Decile 2 | 15.3913 |
| Decile 1 | 9.40731 |
| Minimum | -27.9392 |
|
|
- Mean = 30.502
- Std.dev = 18.1255
- 227 items above graph maximum of 98.8517
|
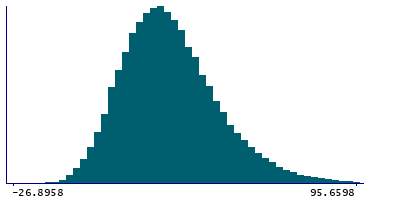
2 Instances
Instance 2 : Imaging visit (2014+)
73,327 participants, 73,327 items
| Maximum | 184.203 |
| Decile 9 | 54.3557 |
| Decile 8 | 44.4376 |
| Decile 7 | 38.0412 |
| Decile 6 | 32.9578 |
| Median | 28.5554 |
| Decile 4 | 24.3993 |
| Decile 3 | 20.1506 |
| Decile 2 | 15.4814 |
| Decile 1 | 9.4633 |
| Minimum | -27.9392 |
|
|
- Mean = 30.6344
- Std.dev = 18.1864
- 213 items above graph maximum of 99.2481
|
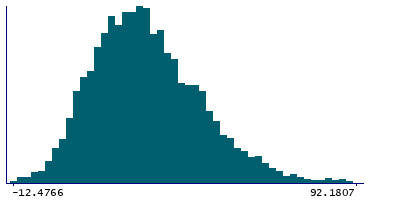
Instance 3 : First repeat imaging visit (2019+)
4,631 participants, 4,631 items
| Maximum | 130.713 |
| Decile 9 | 50.2283 |
| Decile 8 | 41.9605 |
| Decile 7 | 35.495 |
| Decile 6 | 30.7578 |
| Median | 26.5472 |
| Decile 4 | 22.6371 |
| Decile 3 | 18.53 |
| Decile 2 | 14.1067 |
| Decile 1 | 8.35118 |
| Minimum | -12.4766 |
|
|
- Mean = 28.4046
- Std.dev = 16.9962
- 16 items above graph maximum of 92.1054
|
Notes
Median magnetic susceptibility in left putamen (from QSM processing of SWI data)
0 Related Data-Fields
There are no related data-fields


