Data
77,958 items of data are available, covering 73,705 participants.
Defined-instances run from 2 to 3, labelled using Instancing
2.
| Maximum | 227.421 |
| Decile 9 | 105.305 |
| Decile 8 | 96.0223 |
| Decile 7 | 89.7524 |
| Decile 6 | 84.5767 |
| Median | 79.9099 |
| Decile 4 | 75.5006 |
| Decile 3 | 70.9665 |
| Decile 2 | 65.6842 |
| Decile 1 | 58.5889 |
| Minimum | -88.869 |
|

|
- Mean = 81.1388
- Std.dev = 19.1193
- 40 items below graph minimum of 0
- 153 items above graph maximum of 152.022
|
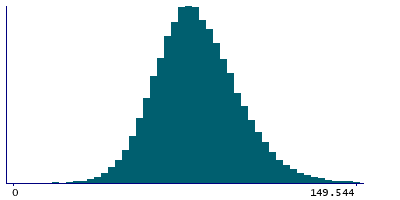
2 Instances
Instance 2 : Imaging visit (2014+)
73,327 participants, 73,327 items
| Maximum | 227.421 |
| Decile 9 | 105.549 |
| Decile 8 | 96.2596 |
| Decile 7 | 89.9301 |
| Decile 6 | 84.7602 |
| Median | 80.0886 |
| Decile 4 | 75.655 |
| Decile 3 | 71.1223 |
| Decile 2 | 65.8398 |
| Decile 1 | 58.6823 |
| Minimum | -88.869 |
|
|
- Mean = 81.317
- Std.dev = 19.1919
- 40 items below graph minimum of 0
- 150 items above graph maximum of 152.415
|
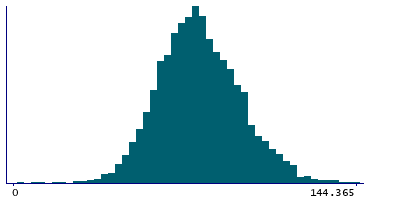
Instance 3 : First repeat imaging visit (2019+)
4,631 participants, 4,631 items
| Maximum | 218.578 |
| Decile 9 | 100.762 |
| Decile 8 | 92.5967 |
| Decile 7 | 86.7117 |
| Decile 6 | 81.4735 |
| Median | 77.2852 |
| Decile 4 | 73.2672 |
| Decile 3 | 68.8278 |
| Decile 2 | 63.6619 |
| Decile 1 | 57.1594 |
| Minimum | 1.57442 |
|
|
- Mean = 78.318
- Std.dev = 17.6925
- 7 items above graph maximum of 144.365
|
Notes
Median magnetic susceptibility in right pallidum (from QSM processing of SWI data)
0 Related Data-Fields
There are no related data-fields


