Data
77,958 items of data are available, covering 73,705 participants.
Defined-instances run from 2 to 3, labelled using Instancing
2.
| Maximum | 35.926 |
| Decile 9 | 2.38364 |
| Decile 8 | -0.606057 |
| Decile 7 | -2.66122 |
| Decile 6 | -4.44538 |
| Median | -6.07175 |
| Decile 4 | -7.66396 |
| Decile 3 | -9.33309 |
| Decile 2 | -11.3429 |
| Decile 1 | -14.1065 |
| Minimum | -50.7974 |
|

|
- Mean = -5.93
- Std.dev = 6.62716
- 30 items below graph minimum of -30.5966
- 70 items above graph maximum of 18.8737
|
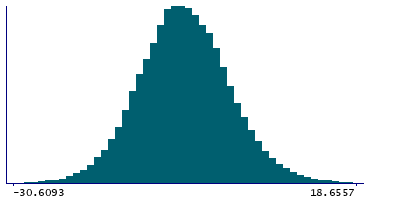
2 Instances
Instance 2 : Imaging visit (2014+)
73,327 participants, 73,327 items
| Maximum | 35.926 |
| Decile 9 | 2.39887 |
| Decile 8 | -0.585109 |
| Decile 7 | -2.63757 |
| Decile 6 | -4.41843 |
| Median | -6.05126 |
| Decile 4 | -7.64262 |
| Decile 3 | -9.31995 |
| Decile 2 | -11.3361 |
| Decile 1 | -14.1068 |
| Minimum | -50.7974 |
|
|
- Mean = -5.91082
- Std.dev = 6.63628
- 28 items below graph minimum of -30.6124
- 69 items above graph maximum of 18.9045
|
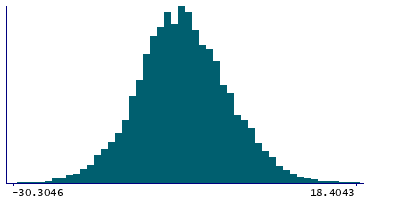
Instance 3 : First repeat imaging visit (2019+)
4,631 participants, 4,631 items
| Maximum | 18.9715 |
| Decile 9 | 2.15923 |
| Decile 8 | -0.975645 |
| Decile 7 | -3.01154 |
| Decile 6 | -4.89709 |
| Median | -6.38731 |
| Decile 4 | -7.99557 |
| Decile 3 | -9.61342 |
| Decile 2 | -11.4057 |
| Decile 1 | -14.0683 |
| Minimum | -33.1796 |
|
|
- Mean = -6.2337
- Std.dev = 6.47346
- 2 items below graph minimum of -30.2958
- 1 item above graph maximum of 18.3868
|
Notes
Median magnetic susceptibility in right hippocampus (from QSM processing of SWI data)
0 Related Data-Fields
There are no related data-fields


