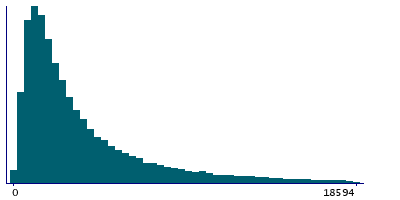
Data
84,907 items of data are available, covering 80,338 participants.
Defined-instances run from 2 to 3, labelled using Instancing
2.
Units of measurement are mm3.
| Maximum | 75413 |
| Decile 9 | 10570 |
| Decile 8 | 6647 |
| Decile 7 | 4715.49 |
| Decile 6 | 3518.01 |
| Median | 2701.01 |
| Decile 4 | 2101 |
| Decile 3 | 1620 |
| Decile 2 | 1205.01 |
| Decile 1 | 798.998 |
| Minimum | 3.27035 |
|
|
- Mean = 4587.7
- Std.dev = 5436.32
- 2053 items above graph maximum of 20341
|
2 Instances
Instance 2 : Imaging visit (2014+)
80,148 participants, 80,148 items
| Maximum | 75413 |
| Decile 9 | 10647 |
| Decile 8 | 6688 |
| Decile 7 | 4744.5 |
| Decile 6 | 3535 |
| Median | 2716.99 |
| Decile 4 | 2114 |
| Decile 3 | 1627 |
| Decile 2 | 1211 |
| Decile 1 | 800.001 |
| Minimum | 3.27035 |
|

|
- Mean = 4616.32
- Std.dev = 5470.87
- 1940 items above graph maximum of 20494
|
Instance 3 : First repeat imaging visit (2019+)
4,759 participants, 4,759 items
| Maximum | 58040 |
| Decile 9 | 9221.5 |
| Decile 8 | 5944.48 |
| Decile 7 | 4261.49 |
| Decile 6 | 3194 |
| Median | 2485 |
| Decile 4 | 1920 |
| Decile 3 | 1516 |
| Decile 2 | 1132.5 |
| Decile 1 | 775 |
| Minimum | 54.9999 |
|

|
- Mean = 4105.69
- Std.dev = 4791.75
- 115 items above graph maximum of 17668
|
Notes
Total volume of peri-ventricular white matter hyperintensities (from T1 and T2_FLAIR images)
0 Related Data-Fields
There are no related data-fields


