Data
84,907 items of data are available, covering 80,338 participants.
Defined-instances run from 2 to 3, labelled using Instancing
2.
Units of measurement are mm3.
| Maximum | 119176 |
| Decile 9 | 2801 |
| Decile 8 | 1361.5 |
| Decile 7 | 847 |
| Decile 6 | 586.999 |
| Median | 428.001 |
| Decile 4 | 317 |
| Decile 3 | 230 |
| Decile 2 | 156.001 |
| Decile 1 | 87.0006 |
| Minimum | 0 |
|

|
- Mean = 1244.3
- Std.dev = 2853.63
- 3804 items above graph maximum of 5515
|
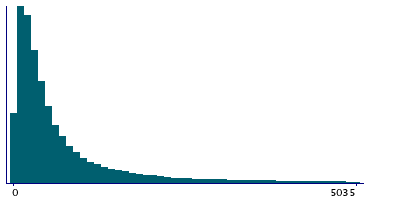
2 Instances
Instance 2 : Imaging visit (2014+)
80,148 participants, 80,148 items
| Maximum | 119176 |
| Decile 9 | 2830 |
| Decile 8 | 1374 |
| Decile 7 | 850.995 |
| Decile 6 | 588 |
| Median | 429.999 |
| Decile 4 | 318 |
| Decile 3 | 230.001 |
| Decile 2 | 156 |
| Decile 1 | 87.0005 |
| Minimum | 0 |
|
|
- Mean = 1254.44
- Std.dev = 2885.71
- 3584 items above graph maximum of 5573
|
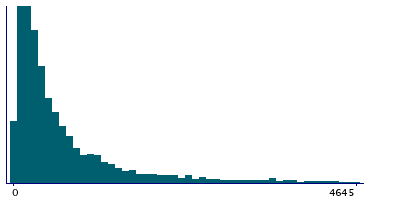
Instance 3 : First repeat imaging visit (2019+)
4,759 participants, 4,759 items
| Maximum | 35599.1 |
| Decile 9 | 2369.99 |
| Decile 8 | 1209 |
| Decile 7 | 784.001 |
| Decile 6 | 563.5 |
| Median | 409 |
| Decile 4 | 308 |
| Decile 3 | 229 |
| Decile 2 | 157.001 |
| Decile 1 | 88 |
| Minimum | 0 |
|
|
- Mean = 1073.54
- Std.dev = 2238.65
- 205 items above graph maximum of 4651.99
|
Notes
Total volume of deep white matter hyperintensities (from T1 and T2_FLAIR images)
0 Related Data-Fields
There are no related data-fields


