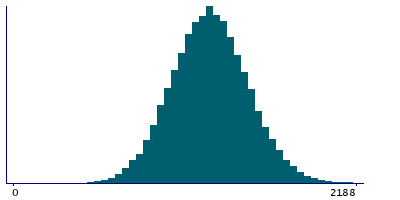
Data
86,640 items of data are available, covering 81,995 participants.
Defined-instances run from 2 to 3, labelled using Instancing
2.
Units of measurement are mm3.
| Maximum | 4138 |
| Decile 9 | 1564 |
| Decile 8 | 1453 |
| Decile 7 | 1374 |
| Decile 6 | 1309 |
| Median | 1247 |
| Decile 4 | 1186 |
| Decile 3 | 1121 |
| Decile 2 | 1044 |
| Decile 1 | 938 |
| Minimum | 203 |
|
|
- Mean = 1250.57
- Std.dev = 248.127
- 114 items above graph maximum of 2190
|
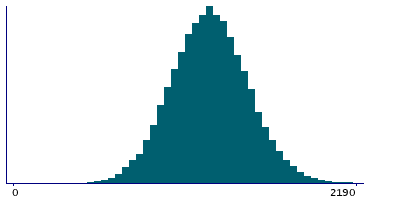
2 Instances
Instance 2 : Imaging visit (2014+)
81,859 participants, 81,859 items
| Maximum | 4138 |
| Decile 9 | 1564 |
| Decile 8 | 1453 |
| Decile 7 | 1374 |
| Decile 6 | 1309 |
| Median | 1248 |
| Decile 4 | 1186 |
| Decile 3 | 1121 |
| Decile 2 | 1044 |
| Decile 1 | 938 |
| Minimum | 203 |
|
|
- Mean = 1250.79
- Std.dev = 248.472
- 111 items above graph maximum of 2190
|
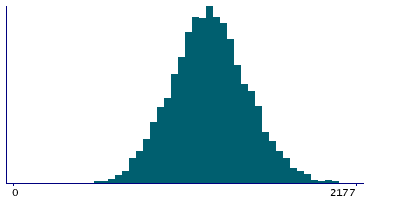
Instance 3 : First repeat imaging visit (2019+)
4,781 participants, 4,781 items
| Maximum | 2382 |
| Decile 9 | 1556 |
| Decile 8 | 1448 |
| Decile 7 | 1367 |
| Decile 6 | 1301 |
| Median | 1242 |
| Decile 4 | 1182 |
| Decile 3 | 1120 |
| Decile 2 | 1044.5 |
| Decile 1 | 935 |
| Minimum | 427 |
|
|
- Mean = 1246.8
- Std.dev = 242.111
- 3 items above graph maximum of 2177
|
Notes
Volume of left amygdala (from T1 brain image)
0 Related Data-Fields
There are no related data-fields
0 Resources
There are no matching Resources
2 Applications
| Application ID | Title |
|---|
| 17689 | Genetic, environmental and lifestyle predictors of brain/cognitive-related outcomes. |
| 22783 | The joint analysis of imaging data and genetic data for early tumor detection, prevention, diagnosis and treatment |
