Data
78,625 items of data are available, covering 74,332 participants.
Defined-instances run from 2 to 3, labelled using Instancing
2.
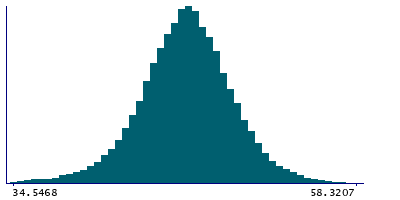
Units of measurement are ms.
| Maximum | 59.4826 |
| Decile 9 | 50.4995 |
| Decile 8 | 49.122 |
| Decile 7 | 48.1777 |
| Decile 6 | 47.3791 |
| Median | 46.6537 |
| Decile 4 | 45.9254 |
| Decile 3 | 45.0915 |
| Decile 2 | 44.0869 |
| Decile 1 | 42.5459 |
| Minimum | 0 |
|
|
- Mean = 46.5281
- Std.dev = 3.34163
- 298 items below graph minimum of 34.5923
- 5 items above graph maximum of 58.4531
|
2 Instances
Instance 2 : Imaging visit (2014+)
73,987 participants, 73,987 items
| Maximum | 59.4826 |
| Decile 9 | 50.5077 |
| Decile 8 | 49.1288 |
| Decile 7 | 48.182 |
| Decile 6 | 47.3832 |
| Median | 46.6553 |
| Decile 4 | 45.9278 |
| Decile 3 | 45.0911 |
| Decile 2 | 44.0795 |
| Decile 1 | 42.5331 |
| Minimum | 0 |
|

|
- Mean = 46.5282
- Std.dev = 3.34598
- 281 items below graph minimum of 34.5584
- 5 items above graph maximum of 58.4824
|
Instance 3 : First repeat imaging visit (2019+)
4,638 participants, 4,638 items
| Maximum | 57.9862 |
| Decile 9 | 50.3363 |
| Decile 8 | 49.0224 |
| Decile 7 | 48.1043 |
| Decile 6 | 47.3103 |
| Median | 46.6276 |
| Decile 4 | 45.9008 |
| Decile 3 | 45.1047 |
| Decile 2 | 44.1749 |
| Decile 1 | 42.7672 |
| Minimum | 0 |
|

|
- Mean = 46.5262
- Std.dev = 3.27158
- 20 items below graph minimum of 35.1981
- 1 item above graph maximum of 57.9053
|
Notes
Median T2star in right thalamus (from SWI data)
0 Related Data-Fields
There are no related data-fields
2 Applications
| Application ID | Title |
|---|
| 17689 | Genetic, environmental and lifestyle predictors of brain/cognitive-related outcomes. |
| 22783 | The joint analysis of imaging data and genetic data for early tumor detection, prevention, diagnosis and treatment |


