Data
83,911 items of data are available, covering 79,384 participants.
Defined-instances run from 2 to 3, labelled using Instancing
2.
Units of measurement are AU.
| Maximum | 0.644926 |
| Decile 9 | 0.446893 |
| Decile 8 | 0.431906 |
| Decile 7 | 0.4213 |
| Decile 6 | 0.412268 |
| Median | 0.403947 |
| Decile 4 | 0.395954 |
| Decile 3 | 0.387348 |
| Decile 2 | 0.377289 |
| Decile 1 | 0.363727 |
| Minimum | 0 |
|
|
- Mean = 0.404787
- Std.dev = 0.0327427
- 10 items below graph minimum of 0.280562
- 20 items above graph maximum of 0.530058
|
2 Instances
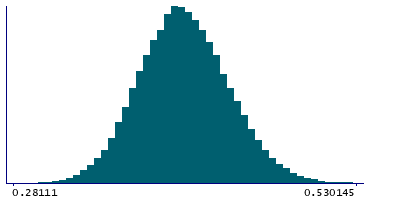
Instance 2 : Imaging visit (2014+)
79,153 participants, 79,153 items
| Maximum | 0.621169 |
| Decile 9 | 0.44718 |
| Decile 8 | 0.432172 |
| Decile 7 | 0.421497 |
| Decile 6 | 0.41248 |
| Median | 0.404145 |
| Decile 4 | 0.396105 |
| Decile 3 | 0.387458 |
| Decile 2 | 0.377447 |
| Decile 1 | 0.363864 |
| Minimum | 0 |
|

|
- Mean = 0.404971
- Std.dev = 0.0328277
- 10 items below graph minimum of 0.280548
- 19 items above graph maximum of 0.530495
|
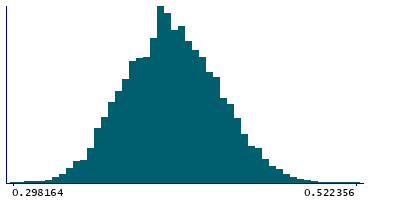
Instance 3 : First repeat imaging visit (2019+)
4,758 participants, 4,758 items
| Maximum | 0.644926 |
| Decile 9 | 0.442084 |
| Decile 8 | 0.428082 |
| Decile 7 | 0.417574 |
| Decile 6 | 0.408866 |
| Median | 0.400931 |
| Decile 4 | 0.393734 |
| Decile 3 | 0.38479 |
| Decile 2 | 0.374931 |
| Decile 1 | 0.361693 |
| Minimum | 0.298164 |
|
|
- Mean = 0.401716
- Std.dev = 0.0311334
- 1 item above graph maximum of 0.522476
|
Notes
Mean FA (fractional anisotropy) in pontine crossing tract on FA skeleton (from dMRI data)
0 Related Data-Fields
There are no related data-fields
2 Applications
| Application ID | Title |
|---|
| 17689 | Genetic, environmental and lifestyle predictors of brain/cognitive-related outcomes. |
| 22783 | The joint analysis of imaging data and genetic data for early tumor detection, prevention, diagnosis and treatment |

