Data
83,911 items of data are available, covering 79,384 participants.
Defined-instances run from 2 to 3, labelled using Instancing
2.
Units of measurement are AU.
| Maximum | 0.827994 |
| Decile 9 | 0.762434 |
| Decile 8 | 0.750394 |
| Decile 7 | 0.741107 |
| Decile 6 | 0.732914 |
| Median | 0.724679 |
| Decile 4 | 0.715915 |
| Decile 3 | 0.705952 |
| Decile 2 | 0.693177 |
| Decile 1 | 0.672786 |
| Minimum | 0.22147 |
|
|
- Mean = 0.720225
- Std.dev = 0.0369901
- 308 items below graph minimum of 0.583139
|
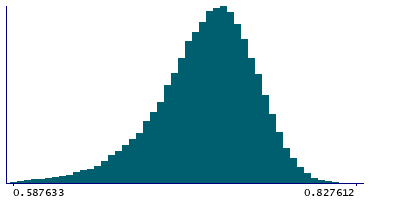
2 Instances
Instance 2 : Imaging visit (2014+)
79,153 participants, 79,153 items
| Maximum | 0.827994 |
| Decile 9 | 0.762295 |
| Decile 8 | 0.750179 |
| Decile 7 | 0.740863 |
| Decile 6 | 0.732651 |
| Median | 0.724404 |
| Decile 4 | 0.715555 |
| Decile 3 | 0.705541 |
| Decile 2 | 0.692778 |
| Decile 1 | 0.6723 |
| Minimum | 0.22147 |
|

|
- Mean = 0.719909
- Std.dev = 0.0371004
- 285 items below graph minimum of 0.582306
|
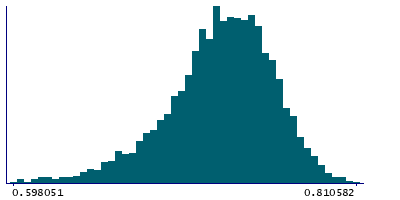
Instance 3 : First repeat imaging visit (2019+)
4,758 participants, 4,758 items
| Maximum | 0.810582 |
| Decile 9 | 0.764393 |
| Decile 8 | 0.753297 |
| Decile 7 | 0.744984 |
| Decile 6 | 0.737058 |
| Median | 0.729367 |
| Decile 4 | 0.721535 |
| Decile 3 | 0.712637 |
| Decile 2 | 0.700442 |
| Decile 1 | 0.681209 |
| Minimum | 0.42377 |
|
|
- Mean = 0.725479
- Std.dev = 0.0346855
- 16 items below graph minimum of 0.598024
|
Notes
Mean FA (fractional anisotropy) in genu of corpus callosum on FA skeleton (from dMRI data)
0 Related Data-Fields
There are no related data-fields
2 Applications
| Application ID | Title |
|---|
| 17689 | Genetic, environmental and lifestyle predictors of brain/cognitive-related outcomes. |
| 22783 | The joint analysis of imaging data and genetic data for early tumor detection, prevention, diagnosis and treatment |

