Data
83,911 items of data are available, covering 79,384 participants.
Defined-instances run from 2 to 3, labelled using Instancing
2.
Units of measurement are AU.
| Maximum | 0.72226 |
| Decile 9 | 0.512255 |
| Decile 8 | 0.501661 |
| Decile 7 | 0.494151 |
| Decile 6 | 0.487612 |
| Median | 0.481469 |
| Decile 4 | 0.475197 |
| Decile 3 | 0.468202 |
| Decile 2 | 0.459917 |
| Decile 1 | 0.447219 |
| Minimum | 0.073749 |
|
|
- Mean = 0.480105
- Std.dev = 0.0268774
- 310 items below graph minimum of 0.382182
- 10 items above graph maximum of 0.577292
|
2 Instances
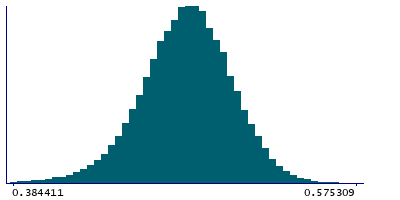
Instance 2 : Imaging visit (2014+)
79,153 participants, 79,153 items
| Maximum | 0.687514 |
| Decile 9 | 0.512224 |
| Decile 8 | 0.501629 |
| Decile 7 | 0.494079 |
| Decile 6 | 0.487536 |
| Median | 0.481386 |
| Decile 4 | 0.47506 |
| Decile 3 | 0.468014 |
| Decile 2 | 0.459727 |
| Decile 1 | 0.447037 |
| Minimum | 0.073749 |
|

|
- Mean = 0.479984
- Std.dev = 0.0269565
- 298 items below graph minimum of 0.381851
- 9 items above graph maximum of 0.577411
|
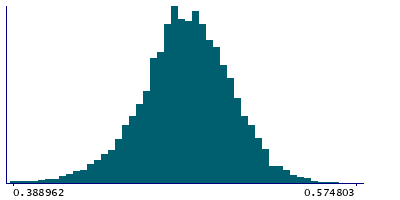
Instance 3 : First repeat imaging visit (2019+)
4,758 participants, 4,758 items
| Maximum | 0.72226 |
| Decile 9 | 0.51286 |
| Decile 8 | 0.502303 |
| Decile 7 | 0.495174 |
| Decile 6 | 0.488878 |
| Median | 0.482965 |
| Decile 4 | 0.476919 |
| Decile 3 | 0.471078 |
| Decile 2 | 0.463313 |
| Decile 1 | 0.450908 |
| Minimum | 0.332375 |
|
|
- Mean = 0.482124
- Std.dev = 0.0254419
- 12 items below graph minimum of 0.388957
- 1 item above graph maximum of 0.574812
|
Notes
Mean FA (fractional anisotropy) in posterior corona radiata (left) on FA skeleton (from dMRI data)
0 Related Data-Fields
There are no related data-fields
2 Applications
| Application ID | Title |
|---|
| 17689 | Genetic, environmental and lifestyle predictors of brain/cognitive-related outcomes. |
| 22783 | The joint analysis of imaging data and genetic data for early tumor detection, prevention, diagnosis and treatment |

